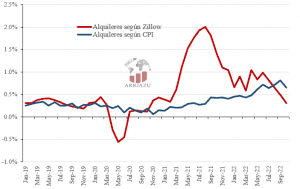
In recent months, many have begun, for the first time in life, to become painfully aware that inflation also exists in the developed world, and especially in the United States.The dollars that have always represented us a shelter for the value of our savings suddenly seem to lose their value at rates near 5% or 6% per year. We see that the Federal Reserve does not stop aggressively raising its monetary policy rate, beating consumption and financial markets, and yet the inflationary problem seems to persist. In this context, it is particularly important that we be careful in reading and interpreting the inflation data that we arrive at, and that we do not learn to draw conclusions.The main price index following the general public to determine inflation in the US is the CPI (Consumer Price Index). The inflation that registers this index is not necessarily the most observed by the Federal Reserve, but the one that has the highest weight in determining people's expectations, and in reading that almost all of us do of the current situation. Last week, it was announced that the inflation of the CPI for the month of October was 0.44%, a given that at first glance it seems alarming; if this rate was kept on average over a year, inflation over 12 months would be 5.4%, well above the 2% target of the EDF. In turn, this 0.44 is above 0.39 that published in September, and 0.12 that published in August. So, anyone would just say that far from solving, the inflationary problem continues to tread strong, and recently just deepened.But we will look at these numbers more carefully. Global inflation accelerates, it is true, but when we go to why, we find that much of the explanation is in the recent recovery of fuel prices. In August, engine fuel prices fell by 10%,5%, which alone already explains a drop of 0.4 points in the overall index. In September, the fall of fuels was already much smaller (-4.8 %), and its contribution to the overall index increased to - 0.2. In October, fuel increased 4%, and the impact was 0.1 in the CPI. What's the point? The general index is being moved according to what prices are very volatile, such as energy (and also food), and lately these prices have been getting strong shocks, which have much to do with what happens globally, and little to do with what goes through doors within the United States, with the demand of people, or the amount of money people want to have in their pocket.So, what number do we look at to have a somewhat cleaner inflation measurement, and debug the impact of volatile international shocks? For this, we look at core inflation, which excludes food and energy prices from the calculation. It is true that this is not the inflation that sits in people's pocket, but if it is a much clearer measure of what is the underlying direction of prices, and that so deep is the monetary imbalance. And it is in this fact that we found something good news; after registering monthly increases of almost 0.6% in the last two months, October has reached a strong slowdown in core inflation, which has been placed at 0.3%.Now, you must also be careful how we interpret this number. Because the reality is that, with the naked eye, it is no longer high: if we annualize it, we reach 3.3 % annually. And if we go to the explanation, we find out that it is the increase in the rents that has been putting a hard floor to break this number.The incomes have a weight of about 40% in the core index, which is not so striking when one takes into account the large proportion of the income that people dedicate to this spending month by month. Therefore, the increase of this component is determinant for what ends up registering in the index. In fact, since July we see a downward trend in average inflation for all other components that affect the core, but the trend towards rising income supports the index at high levels, and greatly increases its slowdown.This dynamic became particularly clear in October, a month when the CPI index had a slight slowdown, but remained at very high levels (0.7%). At the same time, the other components registered in core inflation had an average inflation very close to 0. That is, practically all the core inflation we saw in October is explained pure and exclusively by income, and nothing else.The first thing that leads us to think all of this is if we really saw another bad amount of inflation for the US. Inflation, by definition, is a widespread increase in price levels. When all the underlying inflation explains a single component (as relevant as this is in the consumption basket), and other prices related to education, communication, indumentation, and medical care ironing or falling, it is worth rethinking if what is registering the CPI is truly another month of inflation, and not just a relative price change.The next question is: why are rents so resistant than other prices? Rental contracts shot everywhere in the last year, and in recent months people' patrimony did no more than deteriorate in inflation and impoverishment that generates financial contraction. So why do we see that this market is still so hot? And how much longer can it last, marking the ground for core inflation?The short answer is that, in fact, the rents if they are slowing down, and the CPI simply takes time to reflect. The increase in income that CPI records is delayed in relation to what is happening with the prices of new rental contracts. What is so great is this delay is difficult to determine, and varies according to the depth and duration of shocks affecting the prices of new contracts. To understand why this delay exists, we first have to understand, in great traits, how the CPI identifies the increase of income in a given month.First, a representative sample of the population for a given geographic zone is divided into 6 groups, called panels. Each panel is researched every 6 months; for example, panel 1 is researched in January and then in July, panel 2 is researched in February and then in August, and so on. In each month, the amount of rental prices varied on average for a particular panel over the last 6 months. From this variation of 6 months an average monthly variation is calculated, and hence the data is obtained for a geographic zone and for a particular month.In short, this means that the CPI will not tell you what happened in the last month at the price that appears in a new rental agreement. What you'll say is, on average, at what monthly rate increased rent to people, regardless of when your contract was last updated over the last 6 months.Zillow, famous Real Estate Marketplace, makes an index for rental observed in new contracts, so gives a much more reliable representation of what is occurring with these prices on the margin:[caption id="attachment_6811" align="aligncenter" width="516"] Rezago of the CPI rent index in relation to prices in new contracts [de-stationalized monthly variations] Source: Arriazu Macroanalistas[/caption]As seen in the graph, the acceleration in the prices of income that marks the CPI today is no more than a smoothing of the past dynamics that shows Zillow. As of March 2021, with the relaxation of health restrictions, the new lease contracts had an inflationary boom; they had fallen significantly during the hardest part of the pandemic (with which there was much ground to recover), and in turn the resurgence of demand could not be quickly accompanied by a recomposition in the offer, which took paralyzed one year, and still faced strangulations in the provision of construction materials.After reaching an inflationary peak in August last year, a strong deceleration process began, which was interrupted in March this year; the monetary contraction and the generalized increase in interest rates led to the mortgage credit being sold, so many people who would buy a house opted for rent, boosting prices. And if, if they do not think, this is one of the channels through which the rate rise inflates the price index; the rents rise at the same time that the houses fall, but the housing prices do not enter the CPI.However, we see that from June, a significant slowdown in income prices began again, reflecting that, effectively, when prices began to lose contact with people's incomes, the market began to cool.Ultimately, while the Zillow index tells us that the income market takes a time down, the CPI still reflects the strong increases that occurred months ago. Even after its slowdown in October, it shows an image of the back income market, and little representative of current conditions.For example, if the CPI takes contemporary income inflation, the core inflation reported for October would have been 0.1%, and not 0.3%. Again, it is difficult to estimate how many months will pass until we begin to see a clear correction in the trend of the ICC income index, but until this occurs, we should be careful with the interpretation we make of the general index, and also of the core index; the reality may be another.
11/22/2022 - economy-and-finance
Inflation in the USA: a data to read carefully

Do you want to validate this article?
By validating, you are certifying that the published information is correct, helping us fight against misinformation.
Validated by 0 users

ramiro sciandro
Economist with a master's degree from the Torcuato Di Tella University. Former university lecturer and academic research assistant, currently a macroeconomic analyst for consulting purposes. He worked for 2 years at the Arriazu Macroanalistas firm, with a special focus on the local economy, and currently works in the macro research team at BlackToro Global Investments.
Total Views: 47
Comments