Methods of Japanese Chartism + On-Chain Indicators.
A) Introduction.
B) History.
C) New way to analyze Bitcoin.
D) Final Clarifications.
A) Introduction.
In this note, I show, through empirical examples, how the methods of Japanese chartism, with over 100 years of history and part of the body of knowledge of the CMT, are applied for the first time to on-chain indicators to conduct market analysis on Bitcoin.
The gross price was the main type of data to which these methods were applied. Today, in Bitcoin (the first digital commodity in history), the range of possibilities is much greater, allowing these methods to be applied to a broader set of organic market data (on-chain indicators) beyond the gross price.
B) History.
1) Methods of Japanese Chartism:
In ancient times, in Japan, price representations were drawn by hand. Traders needed to represent the price of a commodity (rice, at that time) correctly and accurately to make decisions with real consequences; mistakes resulted in financial losses. Strategies related to rice and market factors of that time were also used. All this began in the Dojima Rice Exchange in Osaka, considered one of the first organized futures markets in history.
The first person who is said to have conducted this type of analysis was Munehisa Homma. He is attributed with writings from the 18th century on market psychology, considered among the first works on the subject. He then became a financial advisor to the Japanese government and was honored with the title of samurai for his contributions.
These methods continued to develop and be used in Japan for a long time before being shared with the Western world, as they were considered confidential. It wasn't until 1986 that the first book on the topic in English was published: “The Japanese Chart of Charts” by Seiki Shimizu, translated by Gregory S. Nicholson, meaning this body of knowledge has existed formally in the West for only 40 years.
Shortly after, Steve Nison, who was one of the first to receive the CMT designation, established himself as a key figure in the introduction and formalization of chartism in the West, specifically on Wall Street, starting in 1991. He wrote several books, including the widely known “Japanese Candlestick Charting Techniques.” He is also an expert in technical analysis with over 30 years of practical experience. Steve's client list includes Fidelity, J.P. Morgan, Goldman Sachs, and Morgan Stanley. Additionally, his work has been featured in The Wall Street Journal, Worth Magazine, Institutional Investor, and Barron’s.
Prior to Nison, prices were represented in bar format and earlier in lines. He himself compared Japanese candles to these formats like color TV vs black and white TV.
In this sense, it is important to understand that chartism enhances the visual analysis of market data. For example, traditional candles show the internal structure of each period with body/wicks (OHLC - two-dimensional: time and value), Heikin-Ashi smoothens price noise making trends/reversals more visible, and Renko (one-dimensional) completely removes time from the equation focusing solely on value changes. Each of these methods provides a different type of visual market analysis, and you will see them applied to on-chain market indicators of Bitcoin.
It should be noted that there are others apart from these three that I mentioned.
2) CMT Association.
The CMT is a non-profit professional organization that certifies technical market analysts globally. It is the highest institutional authority on the discipline, considered the highest standard in the field.
All the trading material shared in this note comes from authors whose work was evaluated and promoted by the CMT.
The association was founded in 1973 by Ralph Acampora, John Brooks, and John Greeley, arising from informal meetings of technical analysts that began in New York in 1967. Over the following decades, Acampora and the association worked to legitimize the discipline, a goal they finally achieved by obtaining recognition from FINRA and the SEC (U.S.).
Although they promoted pure technical analysis, Acampora himself supports what is called "fusion analysis," the integration of technical and fundamental approaches as the most comprehensive way to analyze markets. In the Bitcoin ecosystem, its on-chain data are interpreted by the industry as fundamental data, and Japanese chartism is directly linked to technical analysis, so what I will show in the following analyses is a type of "fusion analysis" on Bitcoin.
C) New way to analyze Bitcoin.
Technical considerations:
• The analyses will center on price, supply, demand, and Bitcoin holders.
• I selected 6 on-chain indicators: 1) Realized Price UTXO (1d-1s), 2) NUPL - Net Unrealized Profit/Loss of Holders, 3) Apparent Demand Growth, 4) Fund Holdings (Wall Street ETFs), 5) Realized Price UTXO (1s-1m), and 6) Realized Price UTXO (1m-3m), and I show them with 3 methods of Japanese chartism: 1) Renko, 2) Traditional Candles, and 3) Heikin-Ashi Inspired Candles.
• Most of these indicators are commonly represented in line or area format of the same color and on a daily timeframe.
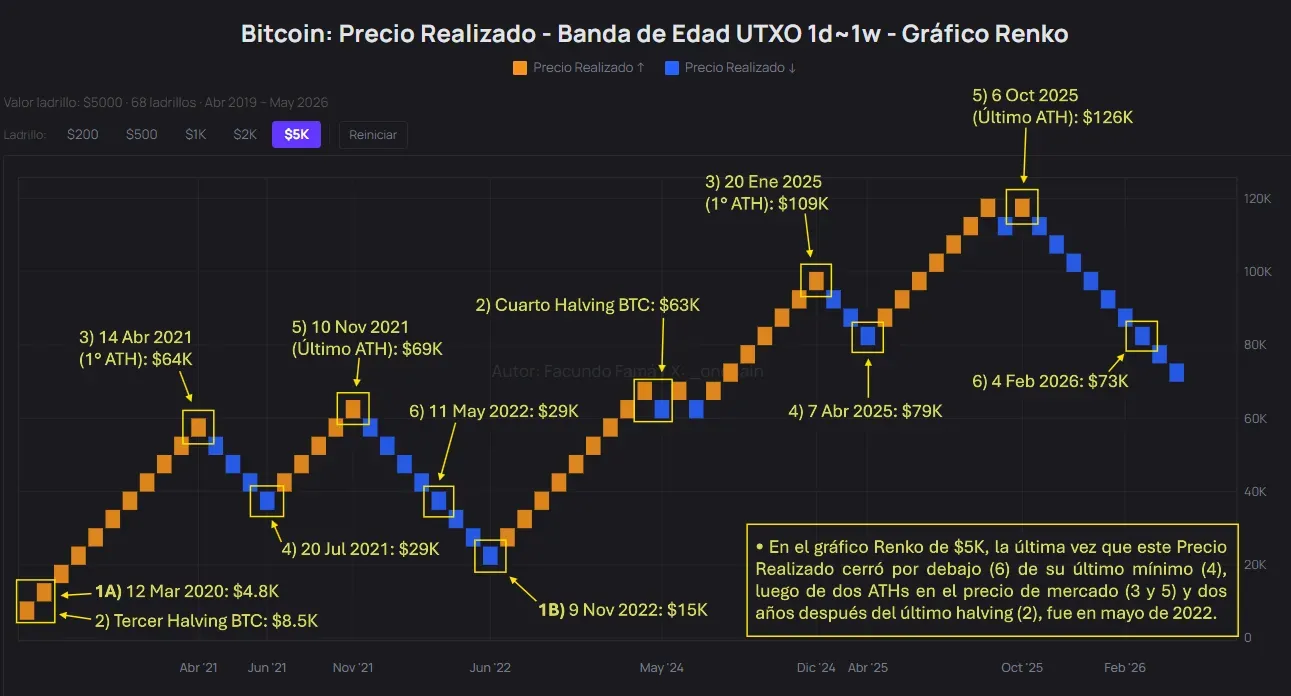
• All price values annotated in yellow correspond to the market price of Bitcoin (closes or highs), NOT indicator values. Specifically, what you are about to see are annotations of the price above on-chain market indicators, to allow a complete analysis of BTC.
• This work is public and auditable.
• I learned to develop my own graphs with the assistance of Claude and use the CryptoQuant database.
• Lastly, beyond the presented graphs, I show different types of analysis that I conducted in English on CQ combining price action and on-chain indicators.
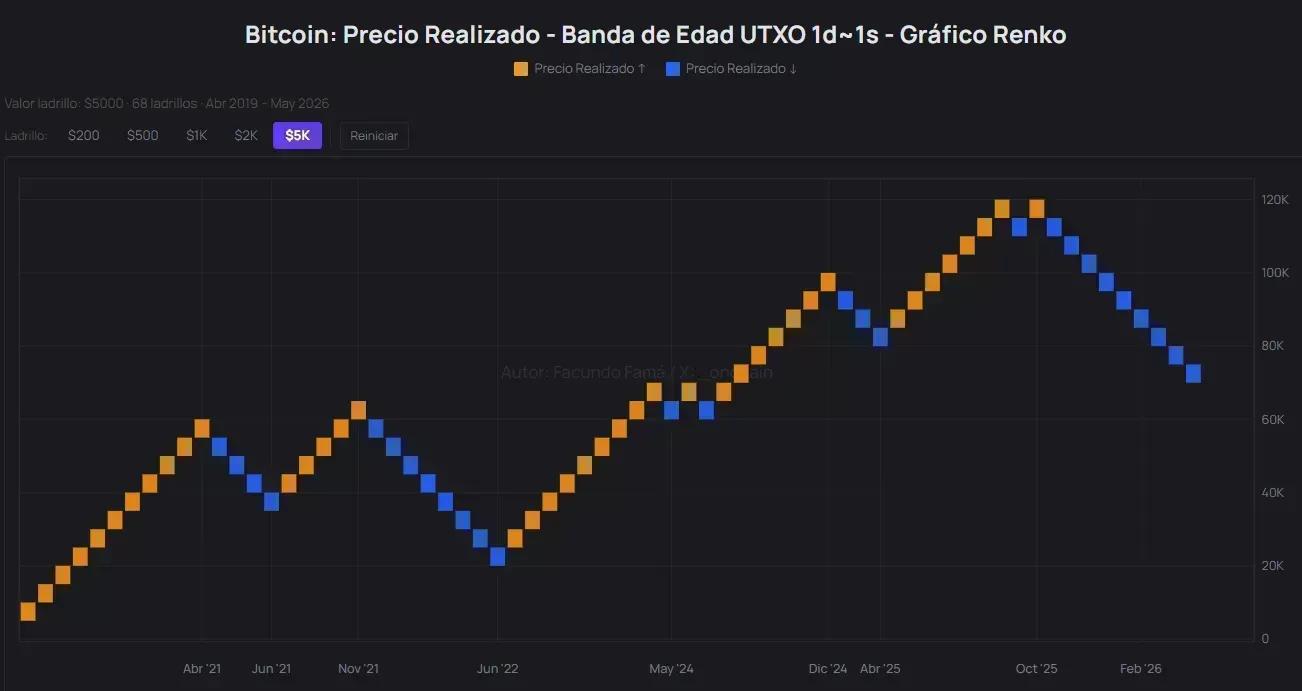
1) 1st Realized Price UTXO. Renko.
These are smoothed average prices with on-chain data derived from the gross market price. They can be comparable to traditional moving averages (SMA50).
Market history, 2020-2026.
This is how the price of Bitcoin looks when analyzing it with on-chain data and Renko, filtering out market noise to see the prevailing trend:
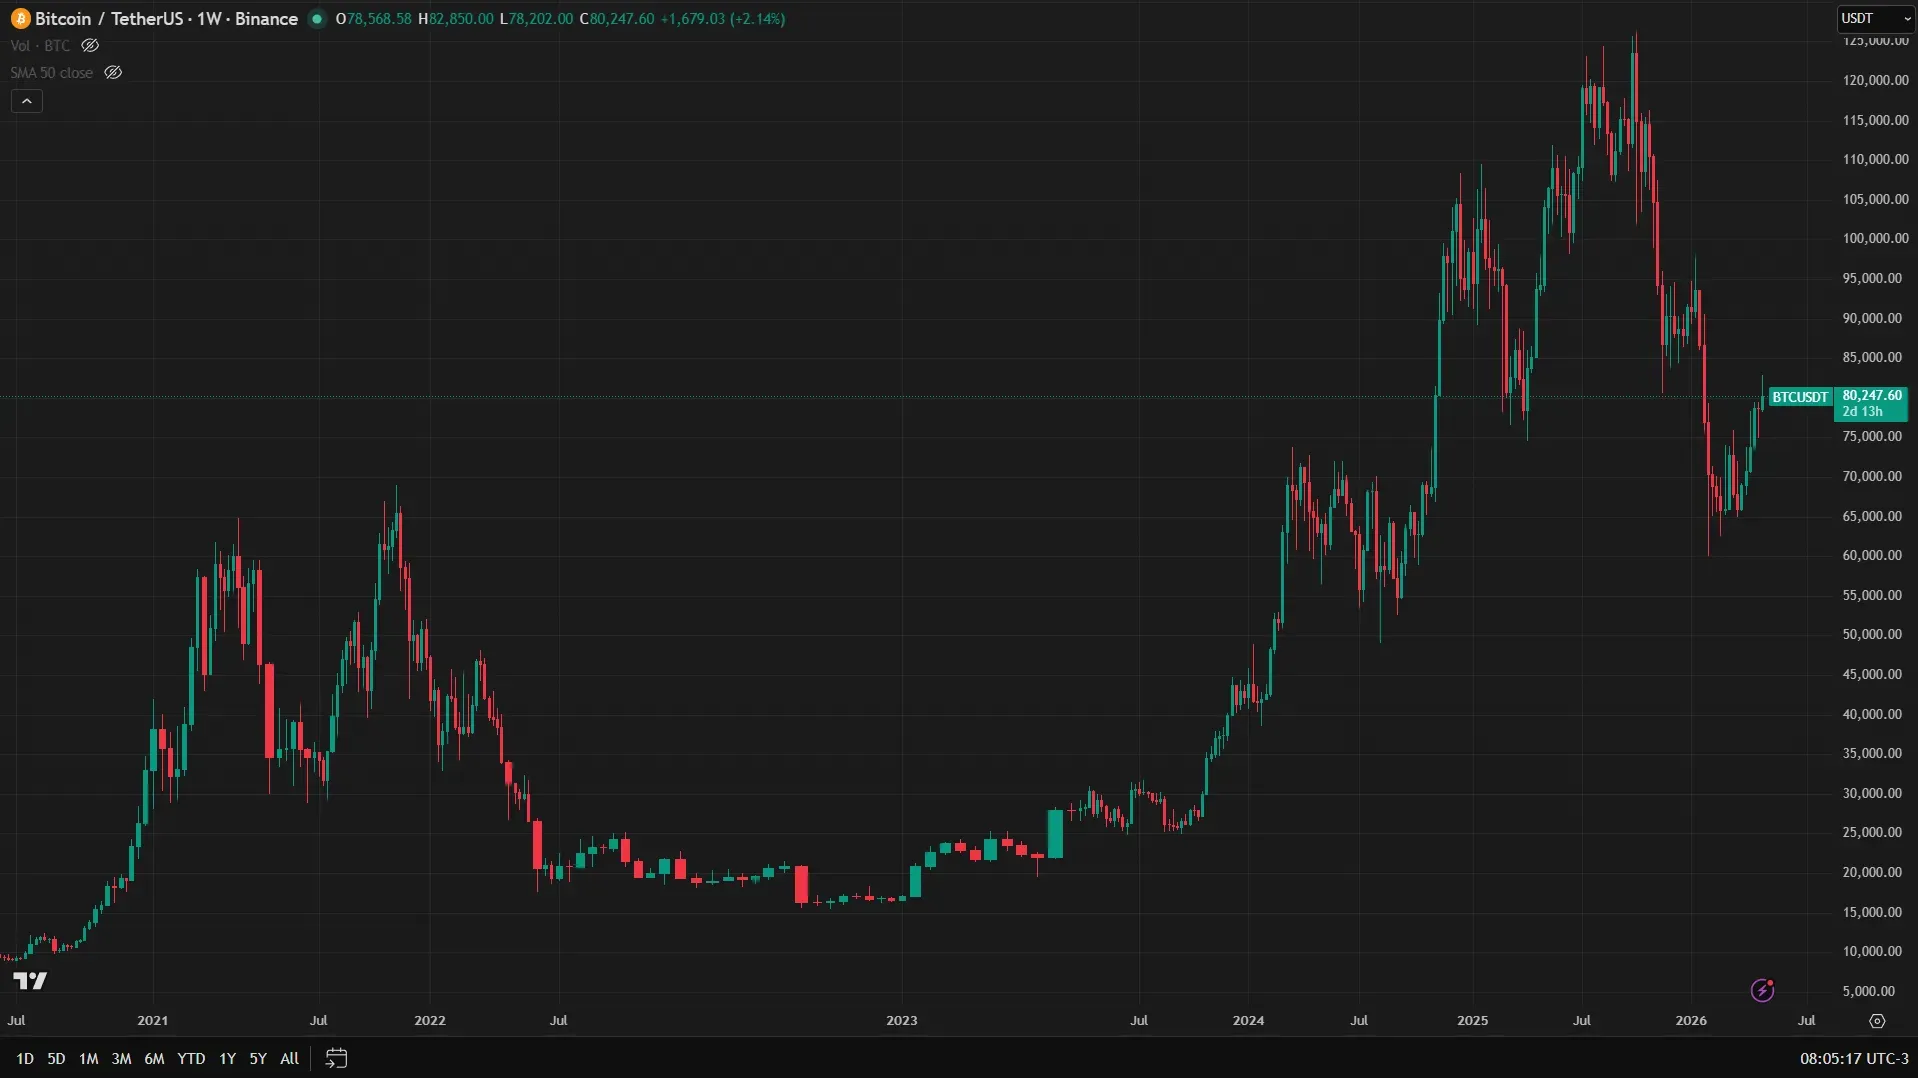
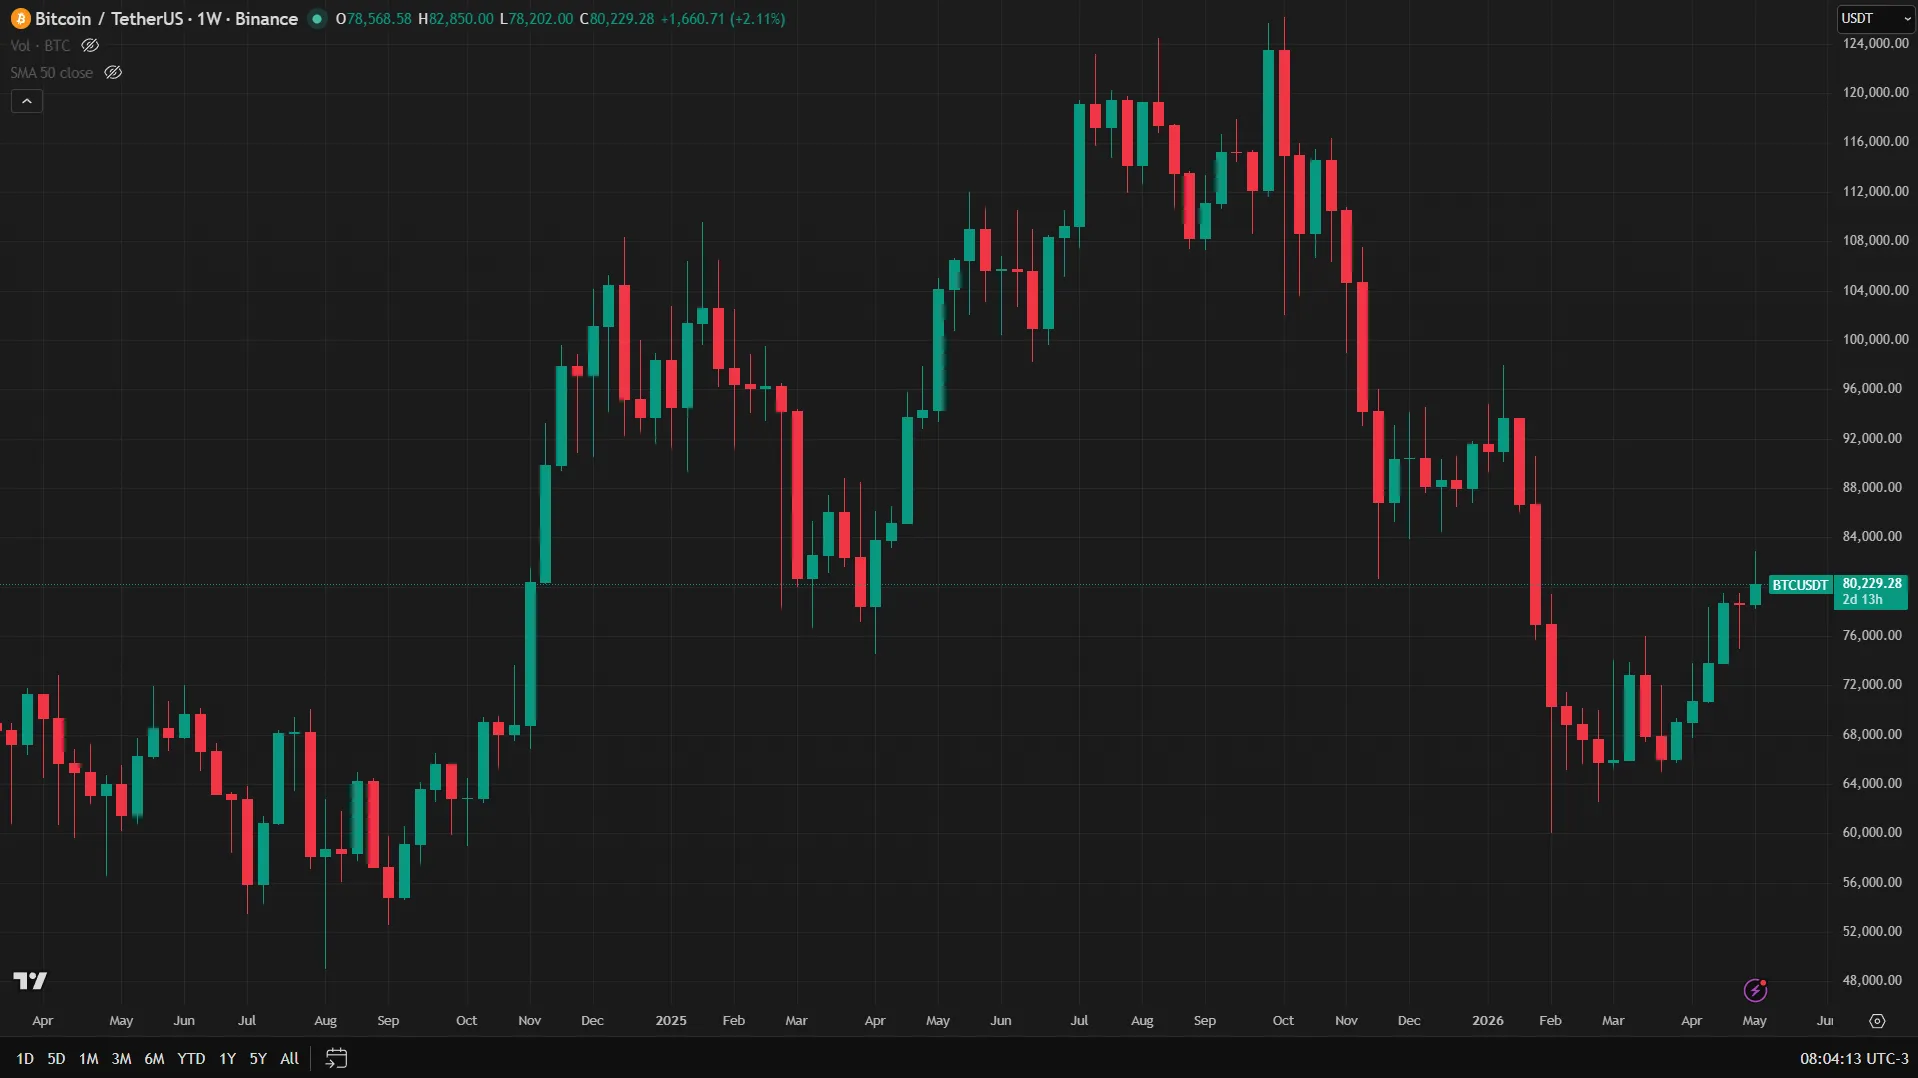
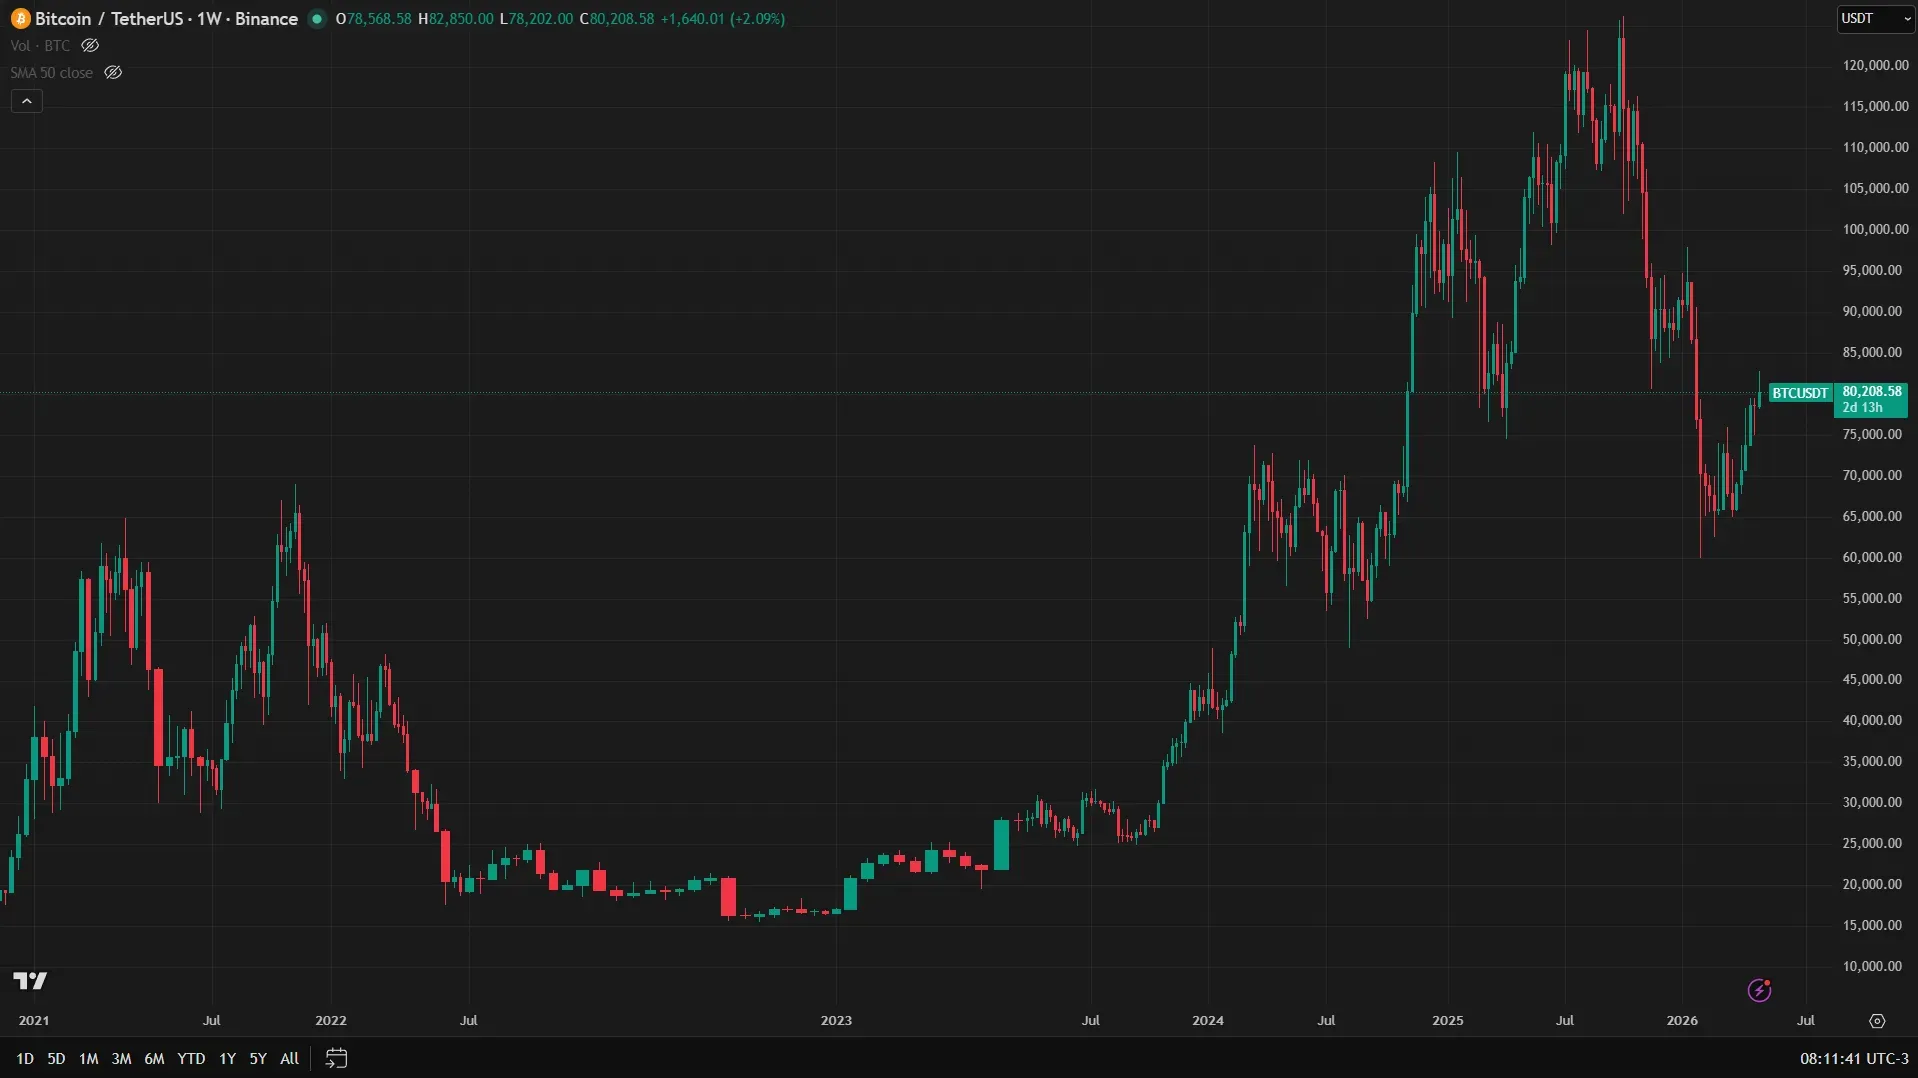
This is how the normal market price of Bitcoin looks with Japanese candles, during the same period, without filtering the noise with on-chain data and Renko:
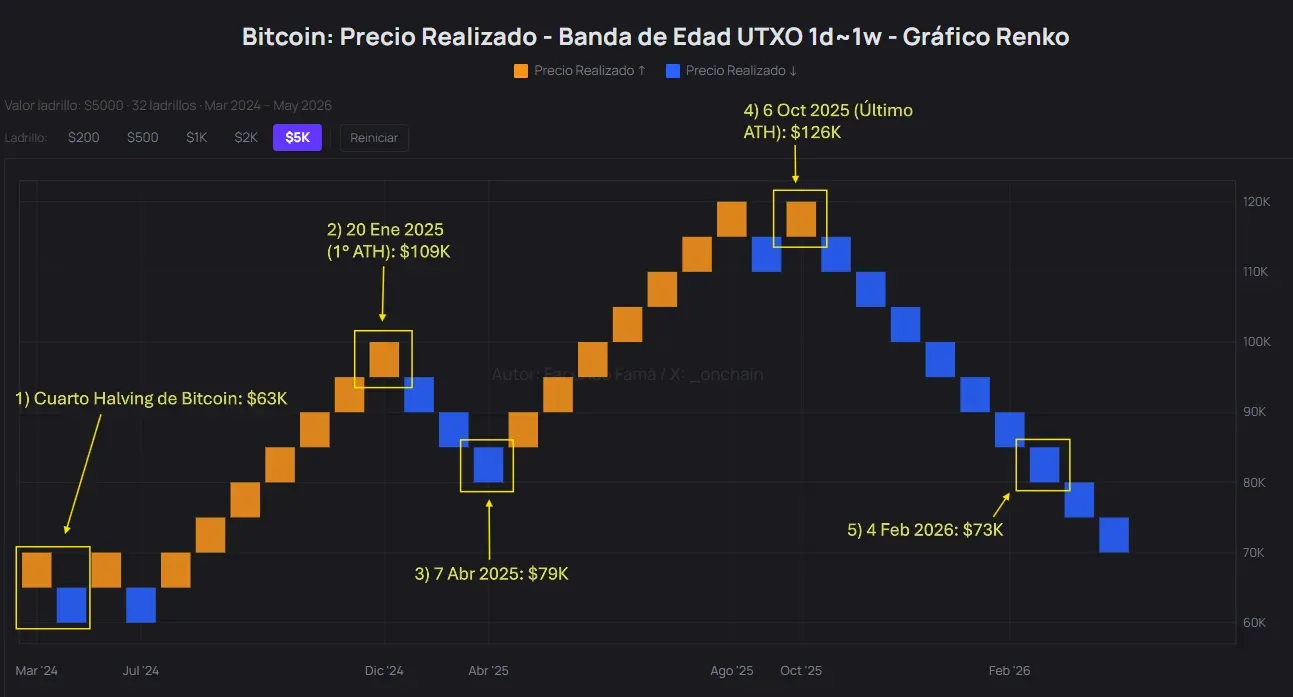
Market history, 2024-2026.
This is how the price of Bitcoin looks when analyzing it with on-chain data and Renko, filtering out market noise to see the prevailing trend:
This is how the normal market price of Bitcoin looks with Japanese candles, during the same period, without filtering the noise with on-chain data and Renko:
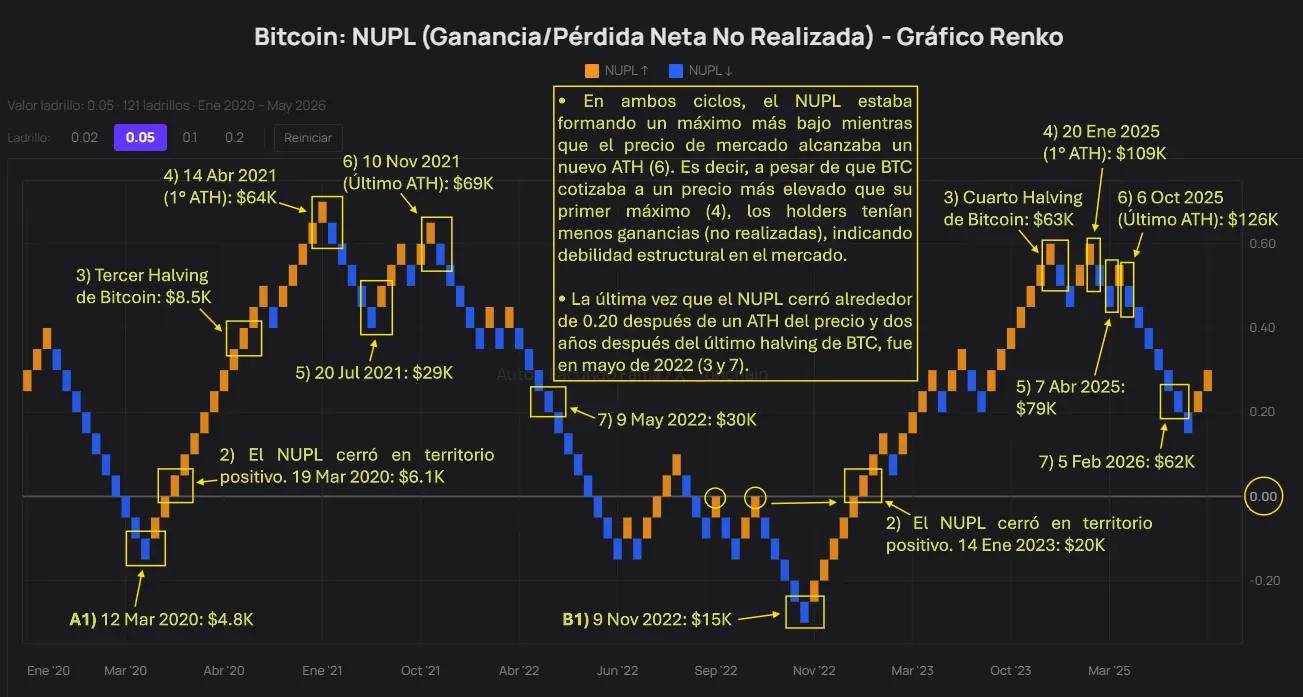
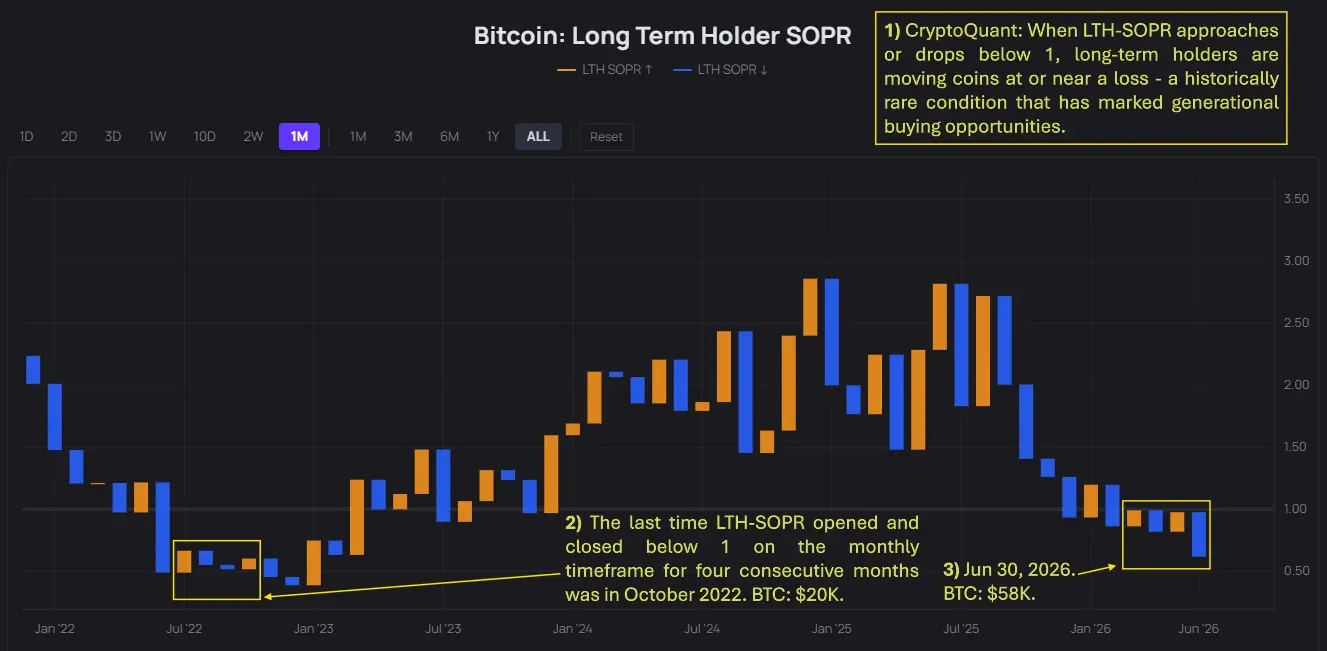
2) NUPL - Net Unrealized Profit/Loss of Holders. Renko.
The NUPL measures how much unrealized (not sold) accumulated profit or loss holders of Bitcoin have.
Market history, 2020-2026:
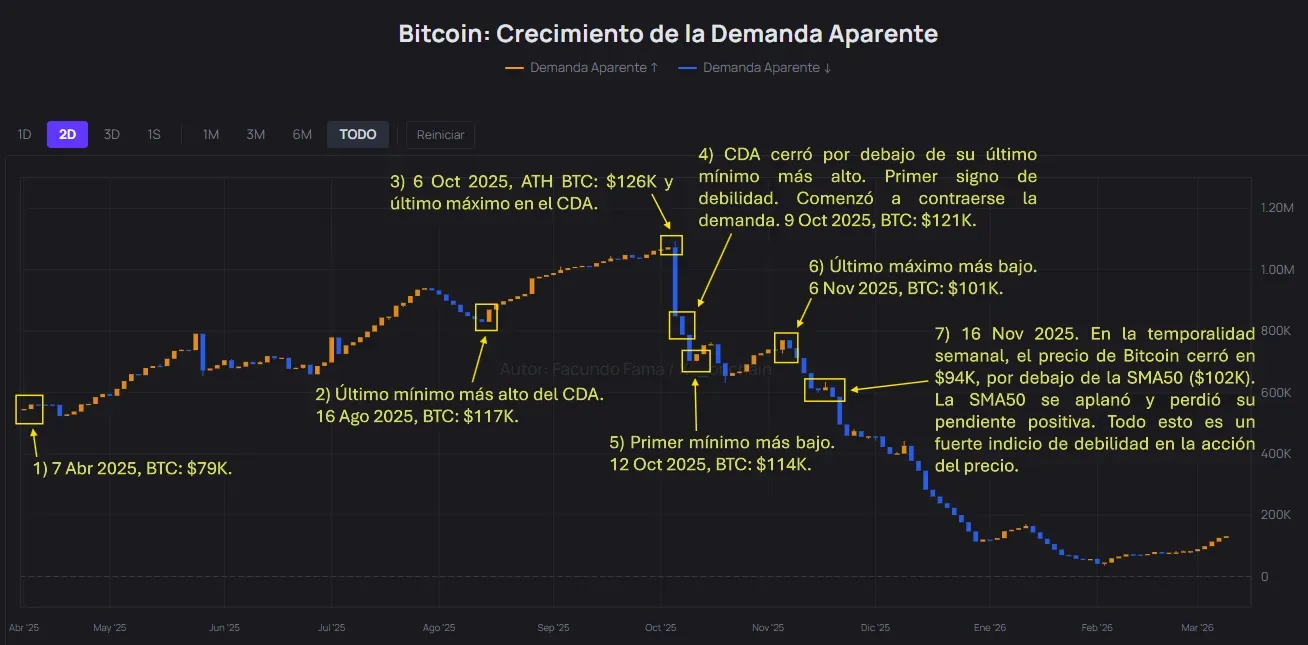
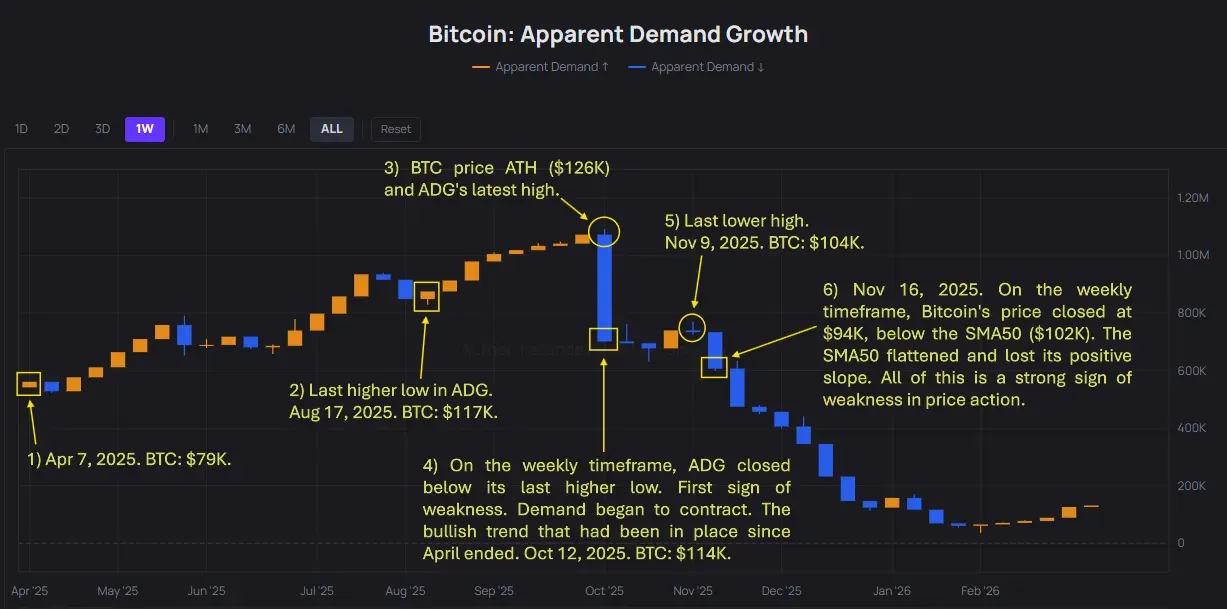
3) Apparent Demand Growth. Traditional Candles.
This is an on-chain indicator that estimates the demand for Bitcoin in the market.
Market history, 2025-2026:
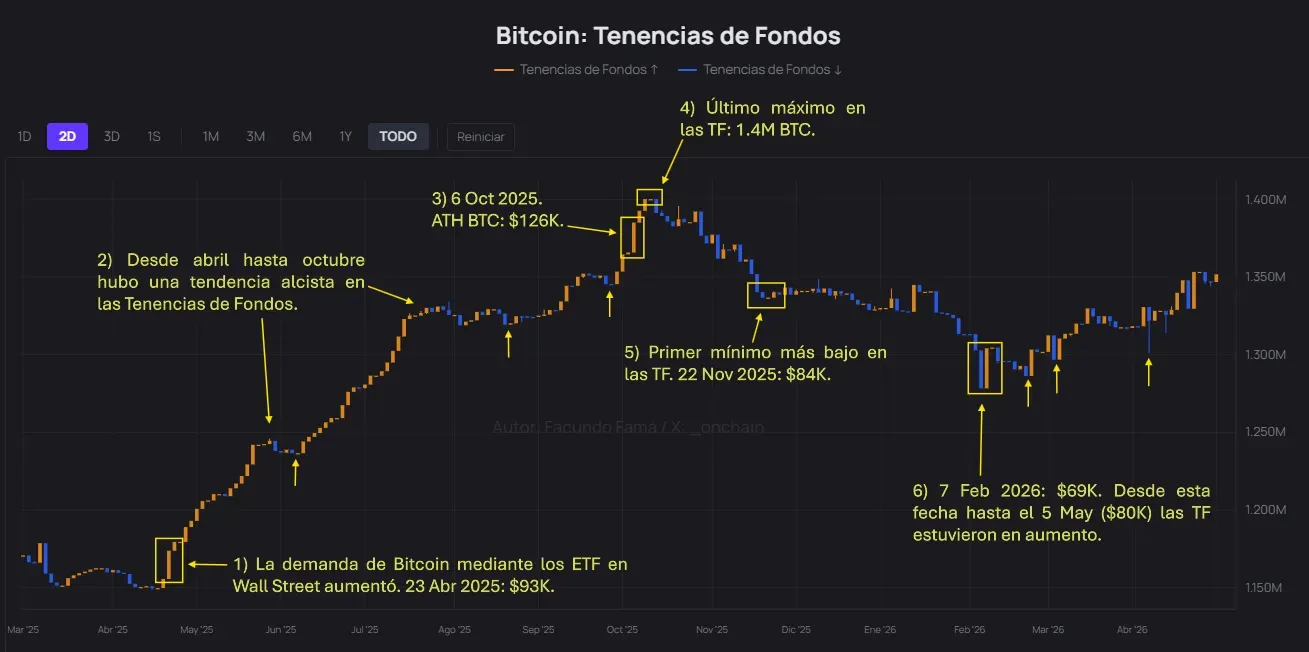
4) Fund Holdings (Wall Street ETFs). Traditional Candles.
Amount of BTC held by Bitcoin ETFs listed on Wall Street.
Market history, 2025-2026:
5) 2nd Realized Price UTXO. Heikin-Ashi Inspired Candles.
Market history, 2024-2026.
This is how the market price of Bitcoin looks smoothed with on-chain data and Heikin-Ashi inspired candles to see the prevailing trend:
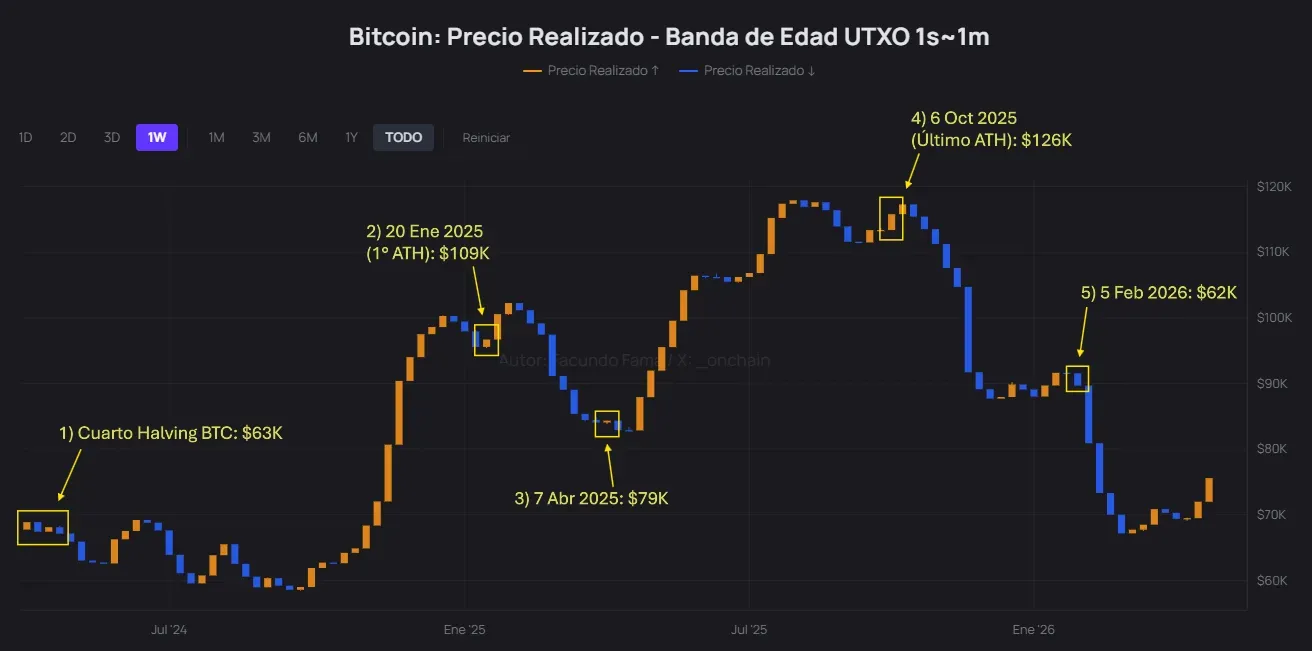
This is how the normal market price of Bitcoin looks with traditional candles, during the same period, without being smoothed by on-chain data and Heikin-Ashi inspired candles:

6) 3rd Realized Price UTXO. Heikin-Ashi Inspired Candles.
Market history, 2020-2026.
This is how the market price of Bitcoin looks smoothed with on-chain data and Heikin-Ashi inspired candles to see the prevailing trend:
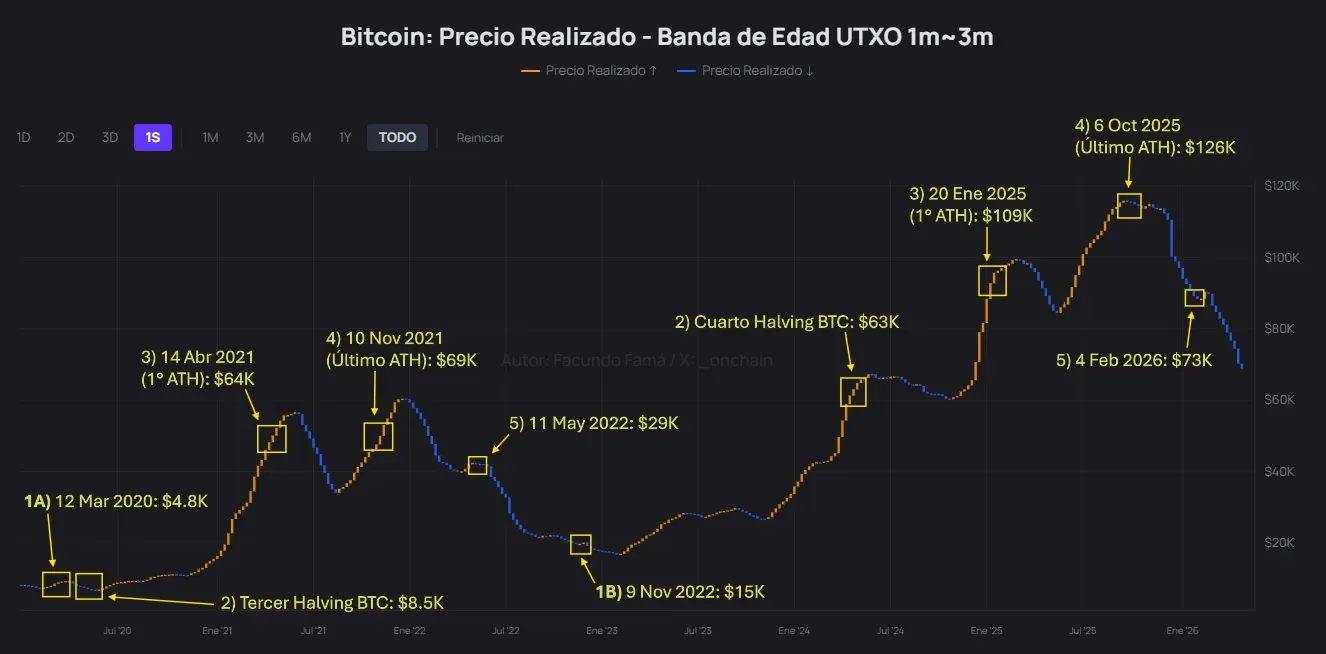
This is how the normal market price of Bitcoin looks with traditional candles, during the same period, without being smoothed by on-chain data and Heikin-Ashi inspired candles:
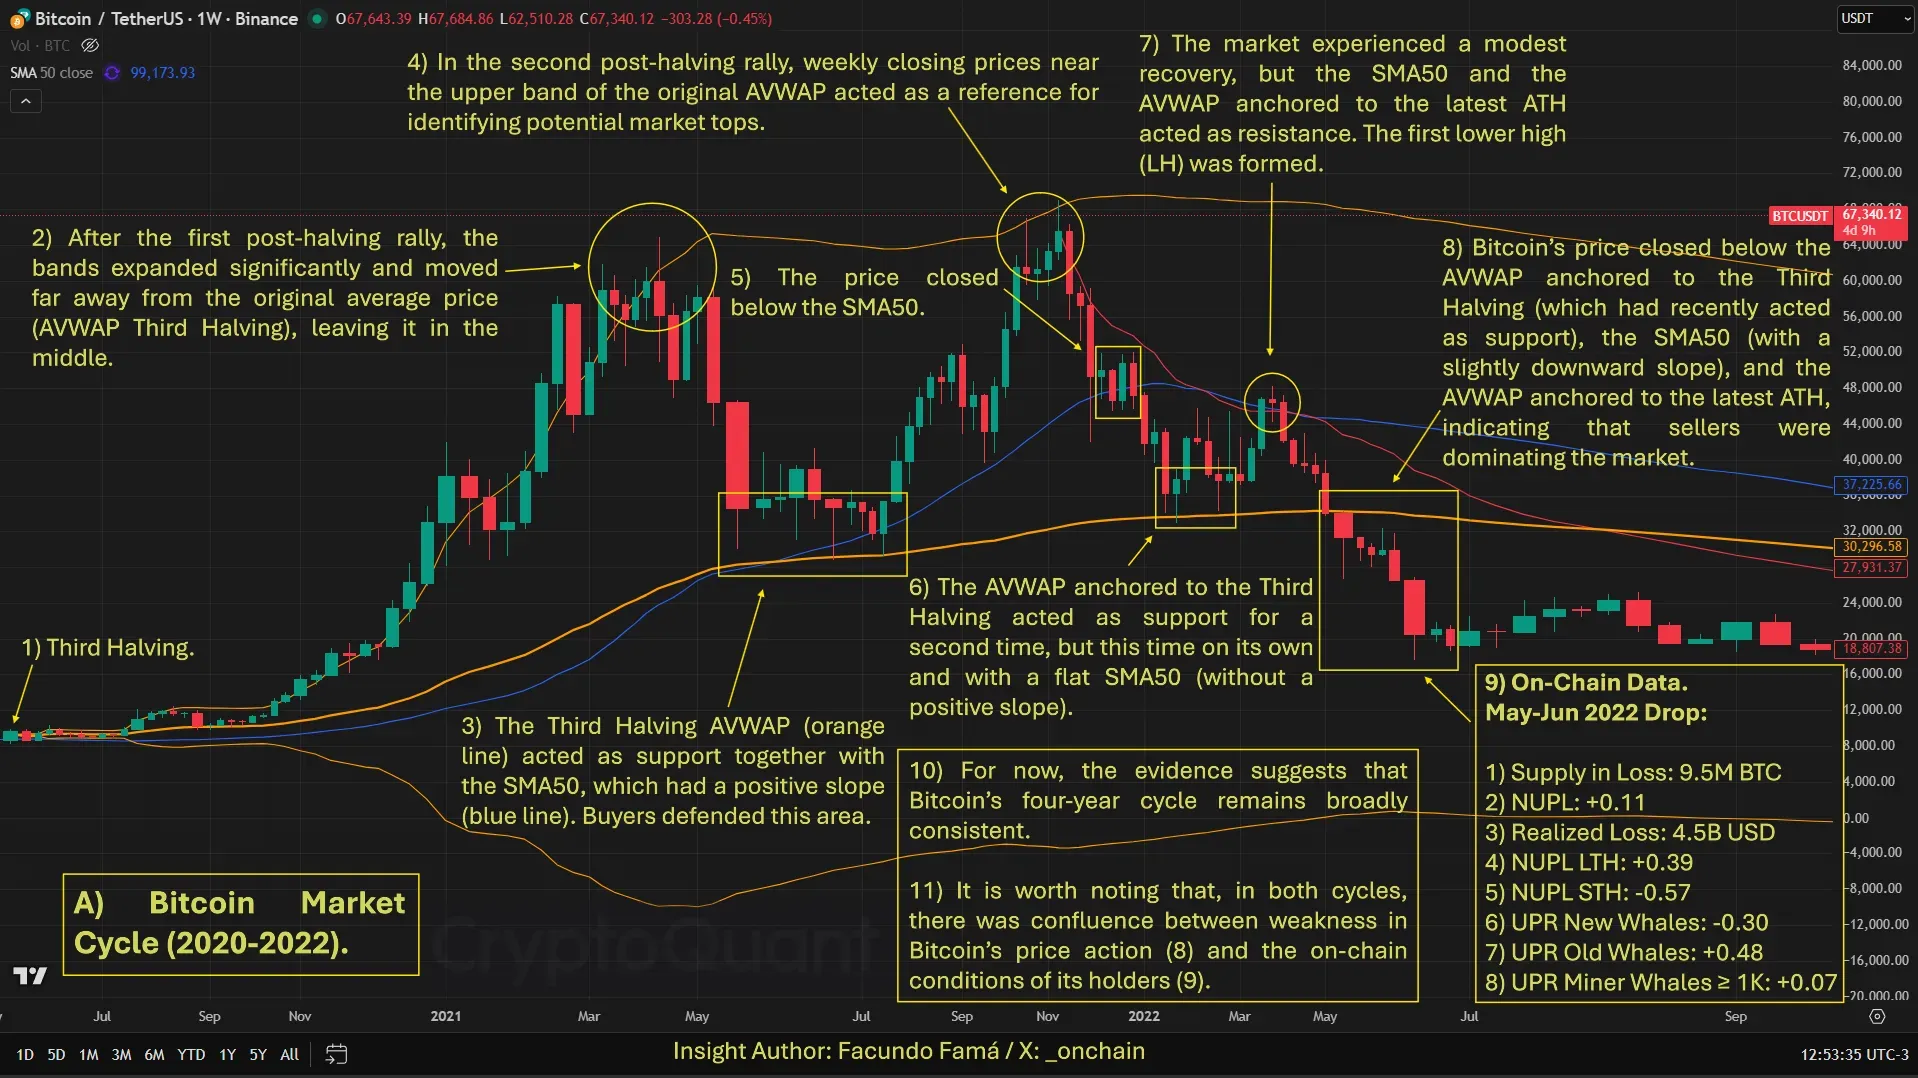
7) Examples of 2 analyses in English that I conducted before combining on-chain indicators with Japanese chartism methods.
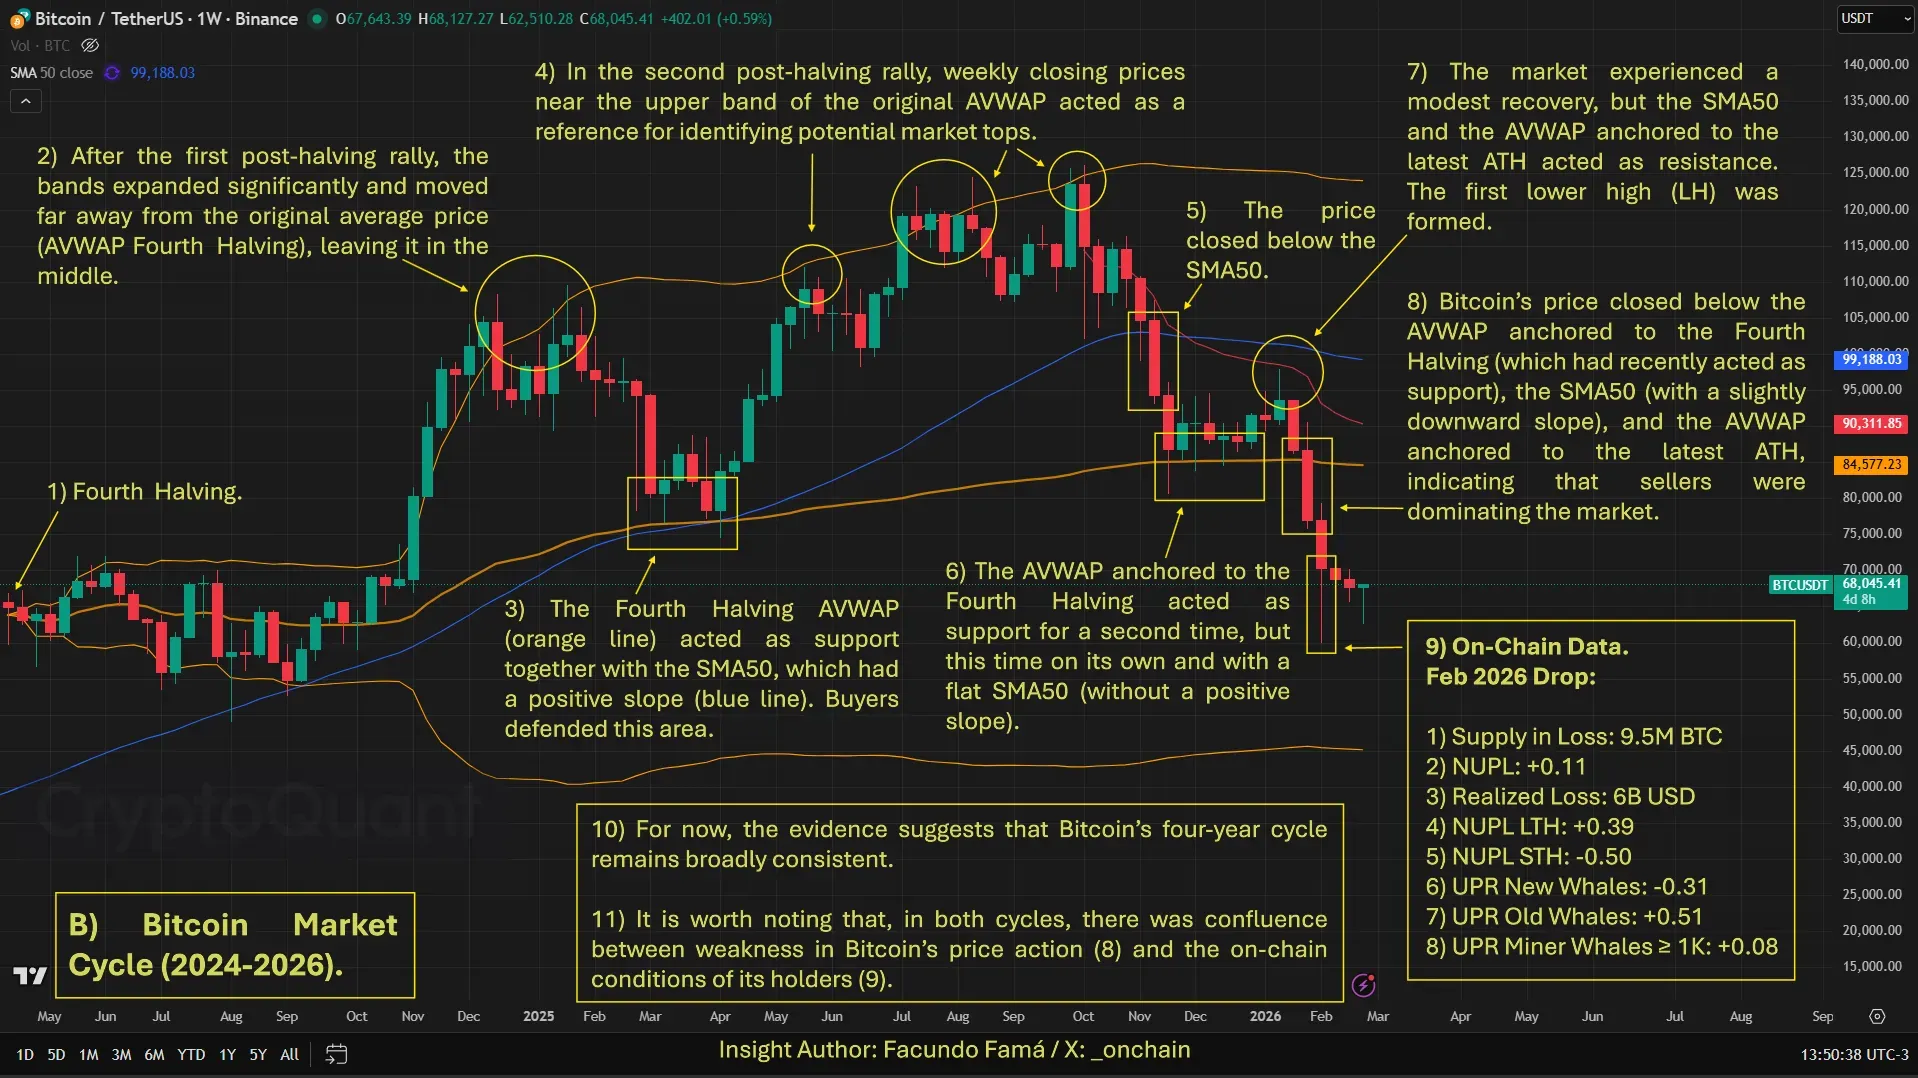
A) I compared the Bitcoin market cycle from 2020-2022 vs 2024-2026.
I used: Anchored VWAPs from the Third and Fourth Halvings of BTC (bands configured with the same deviation - 2.1), Anchored VWAPs from the ATHs of 2021 and 2025, SMA50 (weekly timeframe), Realized Loss - USD, NUPL, Supply in Loss, UPR of New and Old Whales, UPR of Mining Whales, NUPL of LTH and STH.
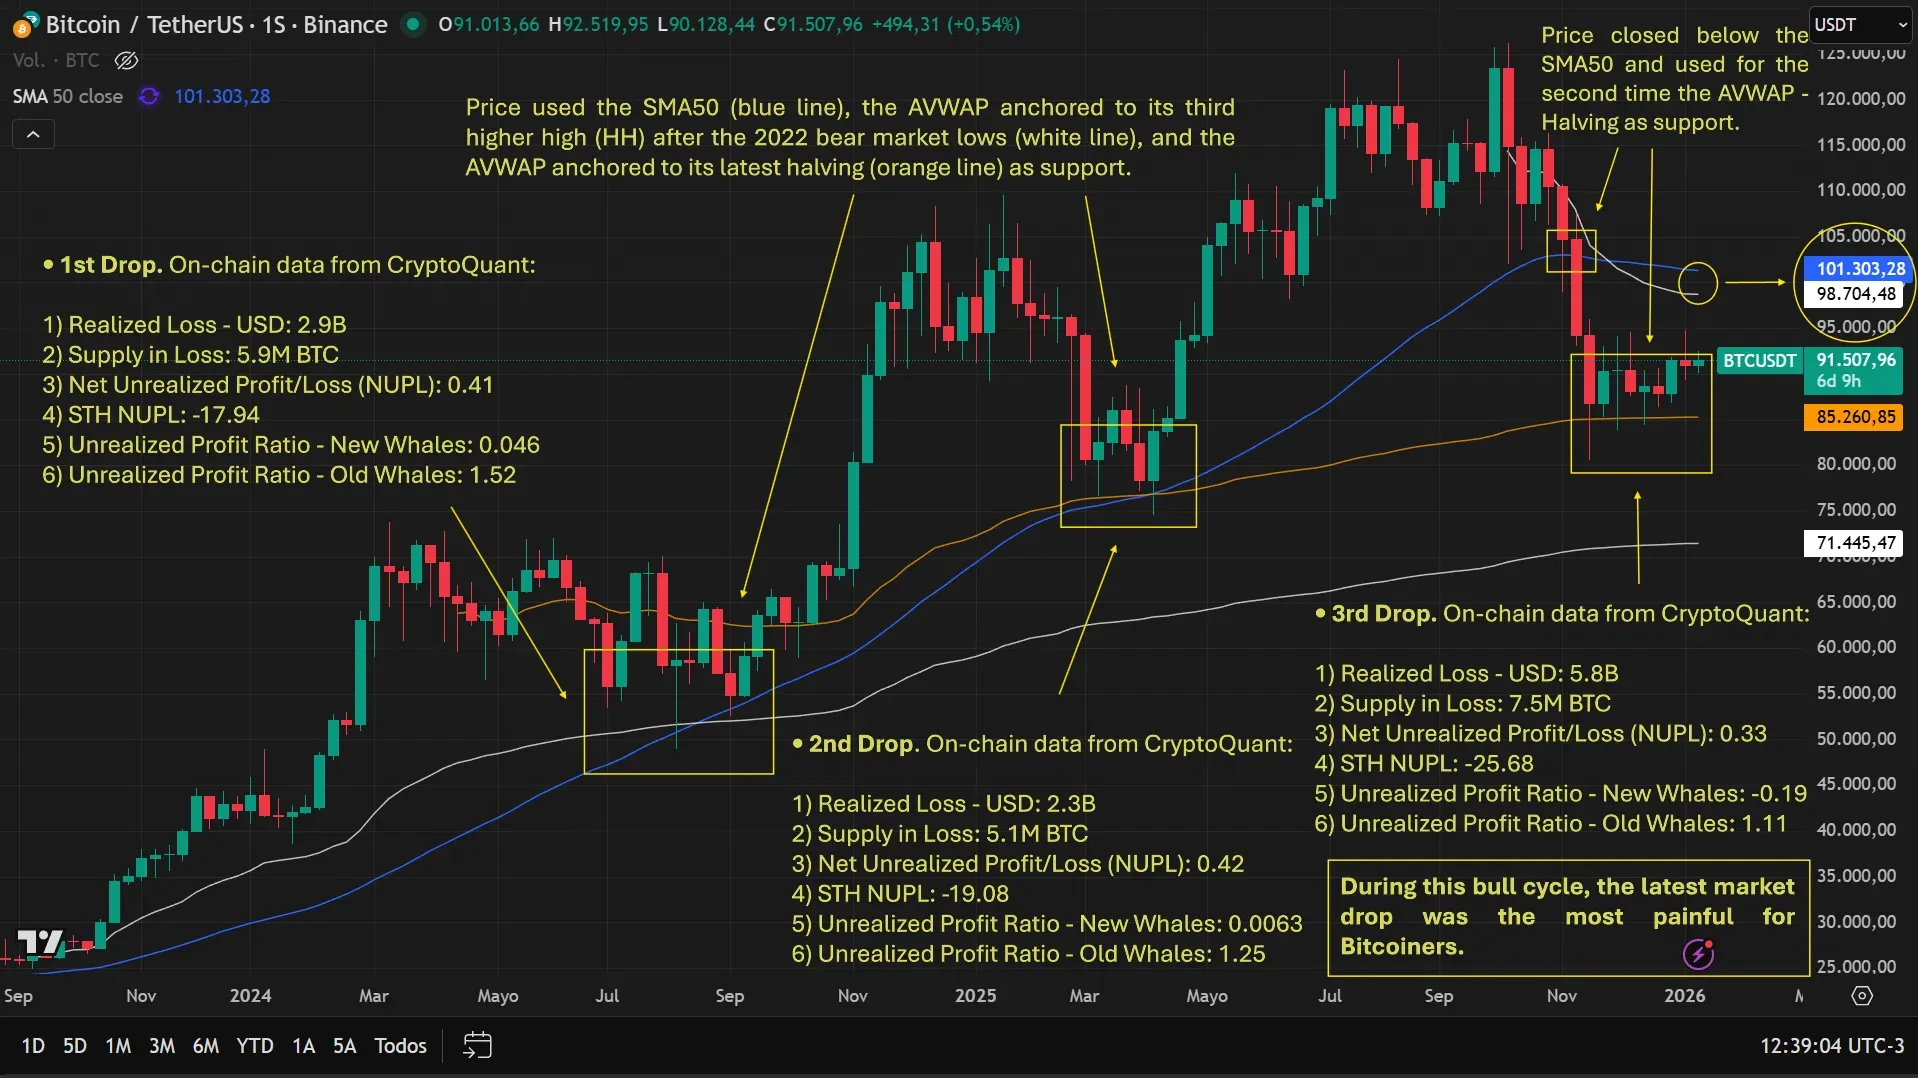
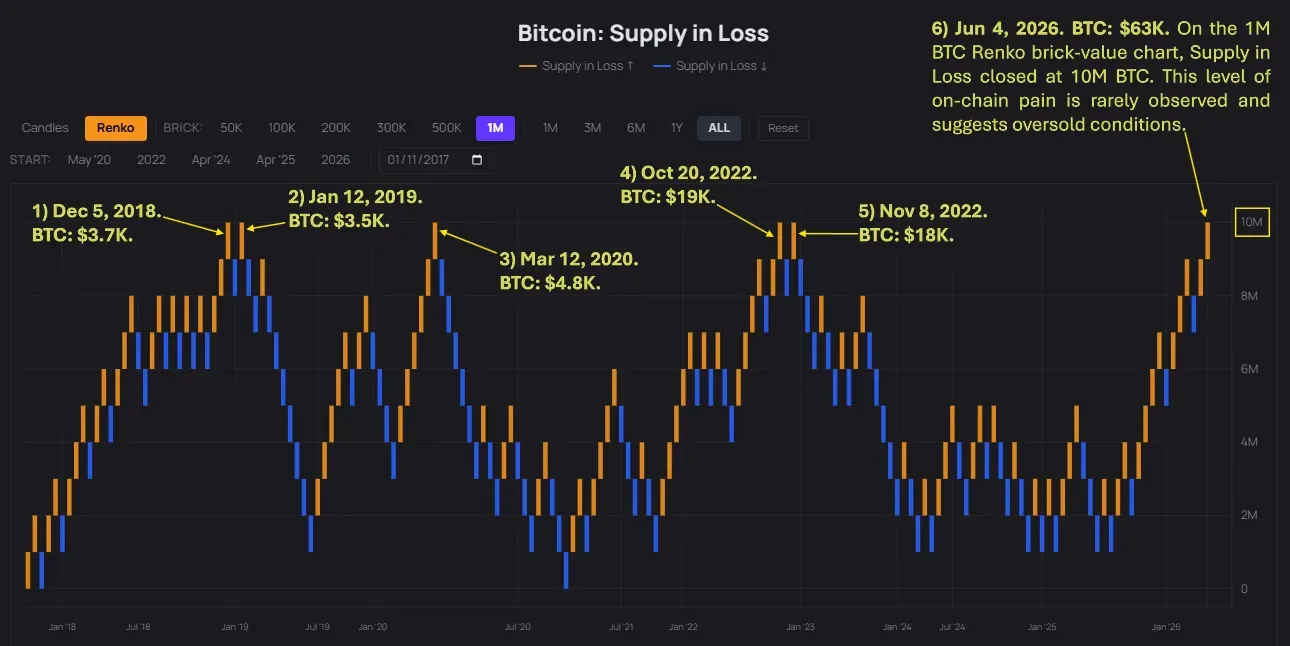
B) I compared the 3 market declines to see which was the most painful for Bitcoin holders.
I used: Realized Loss - USD, Supply in Loss, NUPL, NUPL of STH and UPR of New and Old Whales.
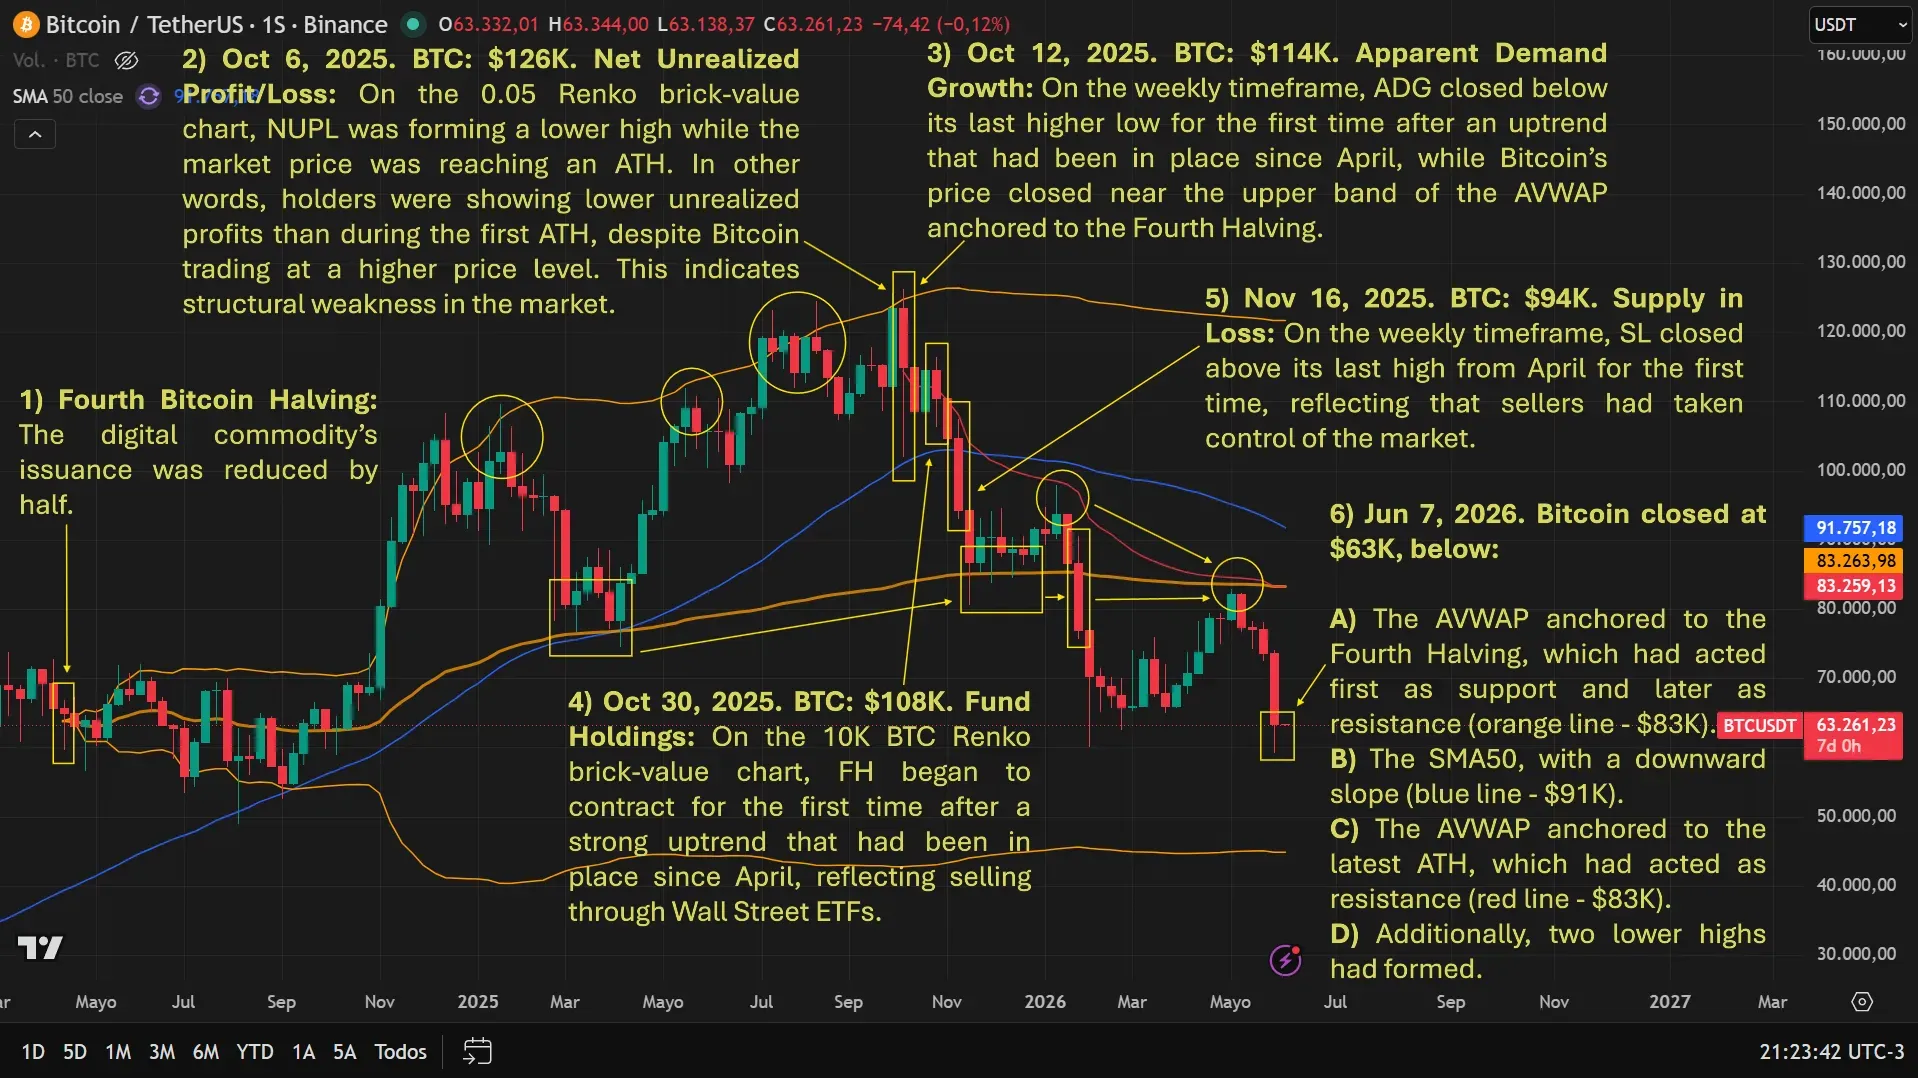
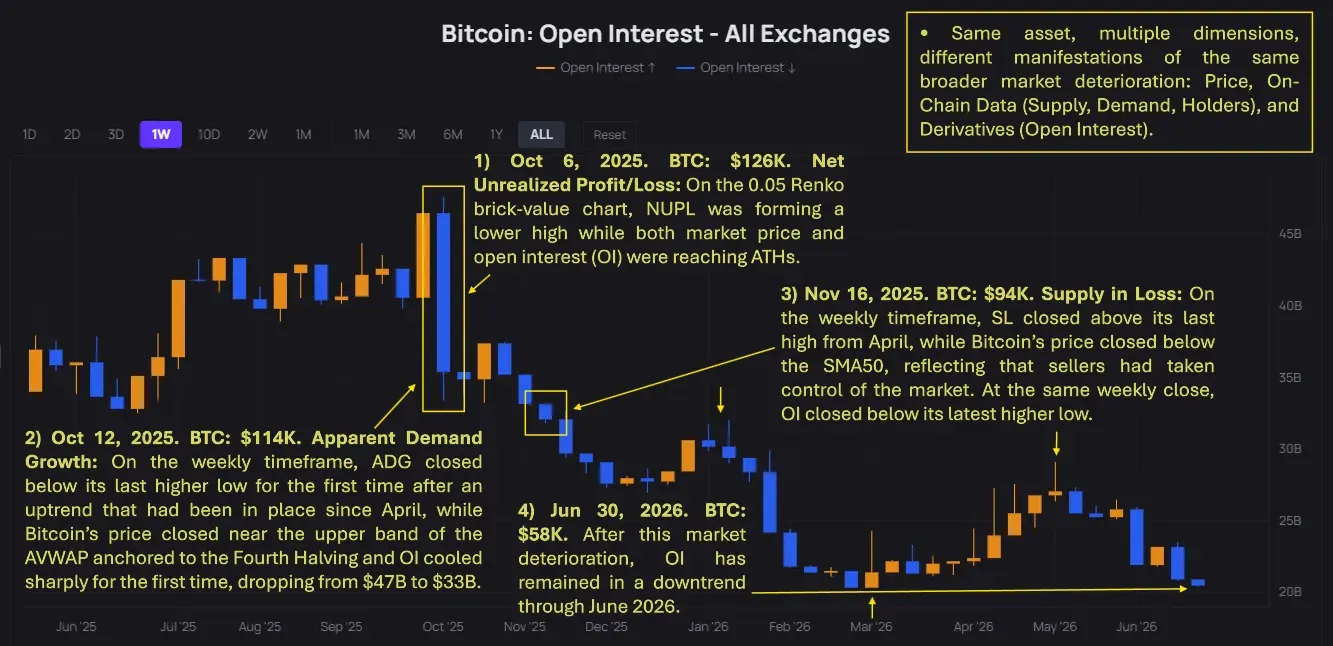
8) On the other hand, I present observations derived from on-chain indicators incorporated in chronological order (not all are in this article; if you want to see the rest, I invite you to consult the technical dashboard that I share at the end of the note). This section was added in June 2026 to continue with images 7 A and B:
9) Finally, I show analyses that I conducted the same month, illustrating the correlation between on-chain indicators and the market price.
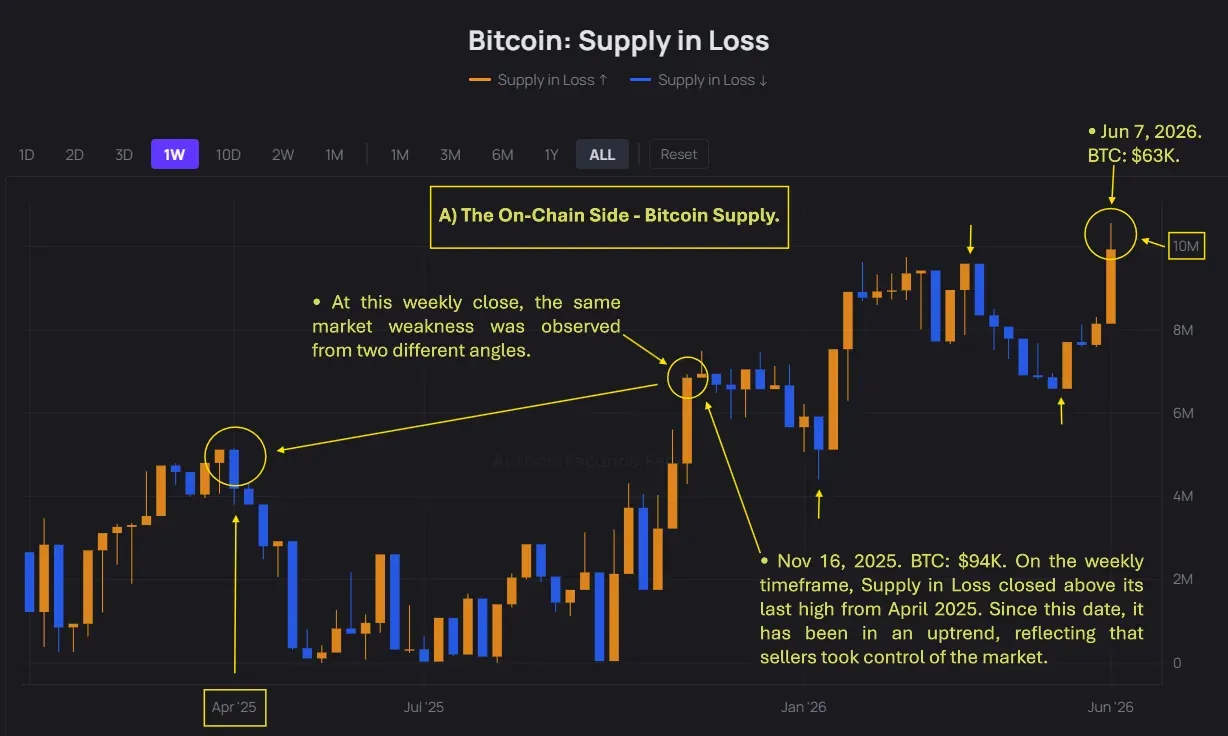
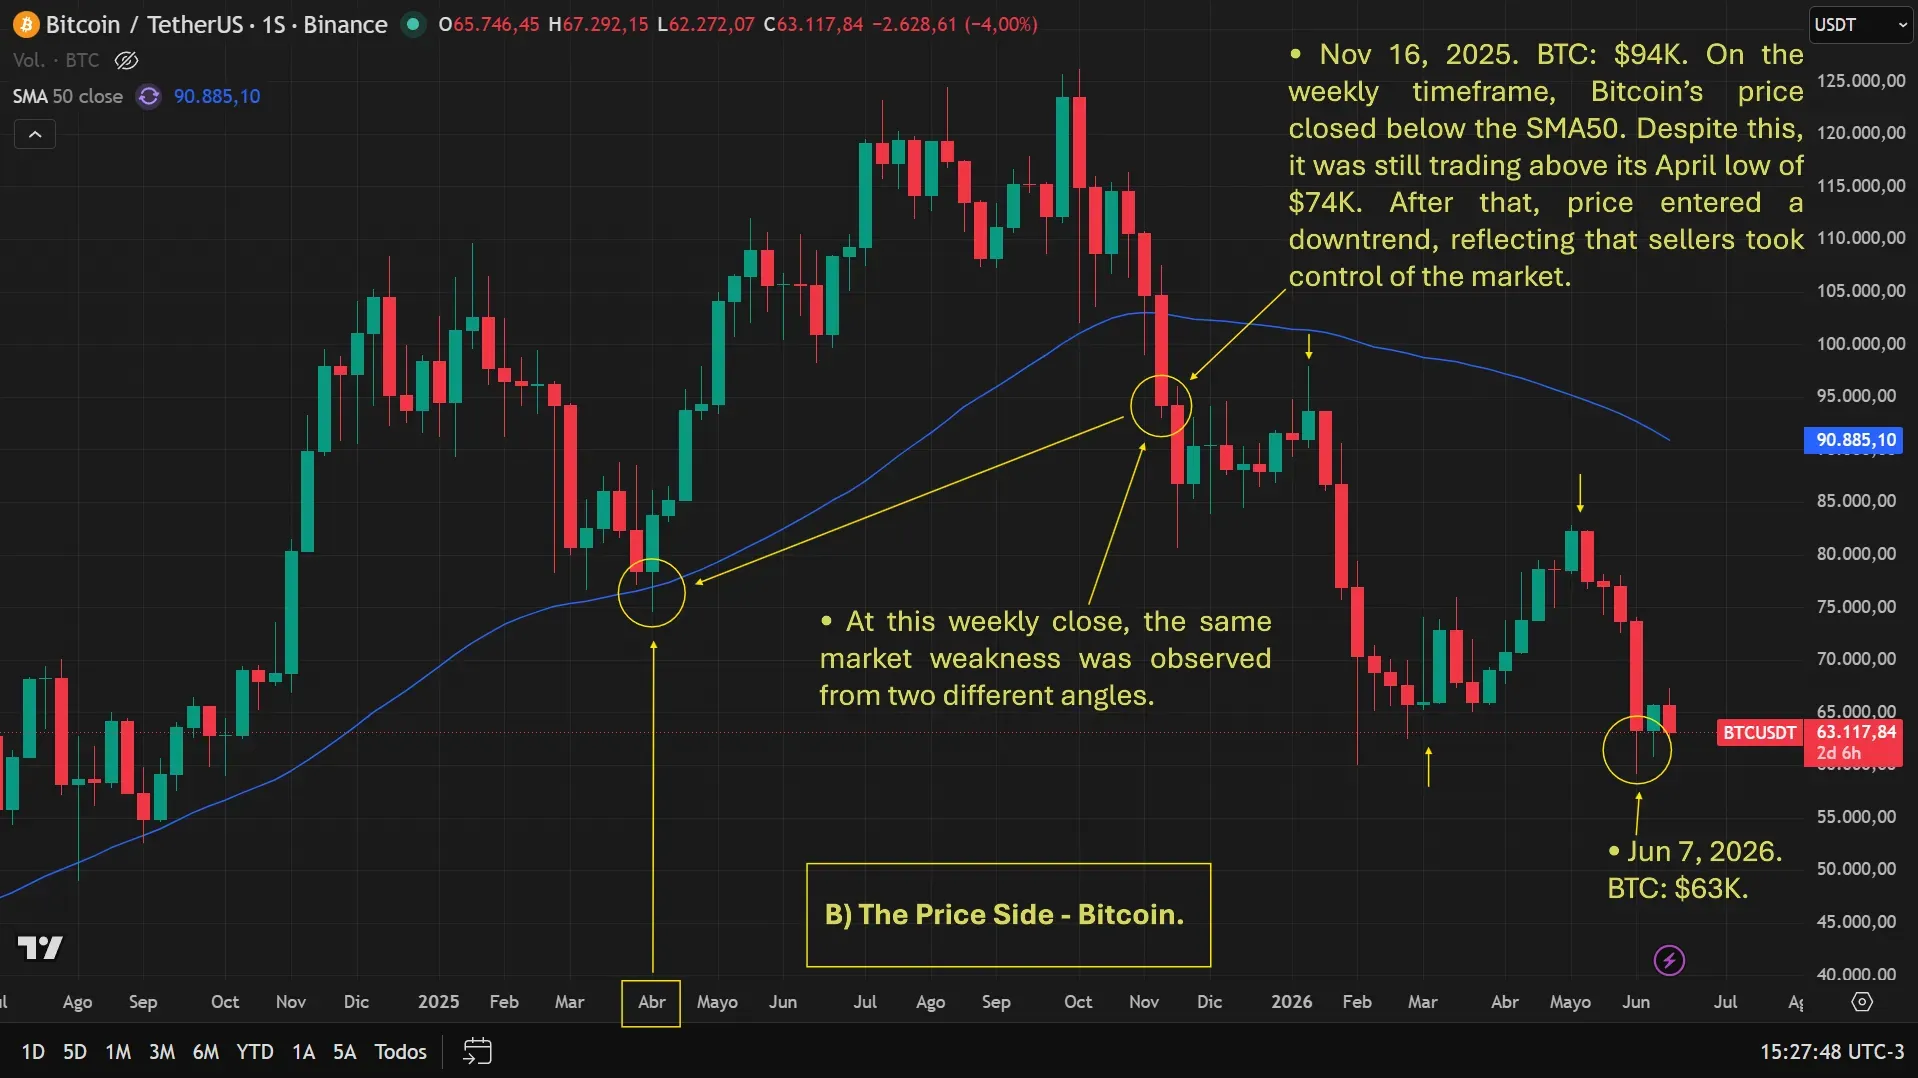
Lower Demand, Lower Price, More Supply in Loss:

D) Final Clarifications.
• I reference different types of links related to the CMT and authors who have deepened the study of Japanese chartism and other professional trading techniques:
https://cmtassociation.org/association/history/
https://cmtassociation.org/presenter/steve-nison/
https://cmtassociation.org/presenter/dan-valcu/
https://cmtassociation.org/presenter/brian-shannon/
https://cmtassociation.org/presenter/prashant-shah/
• If you are interested in learning more about this topic, I invite you to explore the technical dashboard I built on CryptoQuant, which contains 32 reference links, over 30 developed graphs, and various types of market analysis on BTC and ETH, combining: price action, on-chain data, and derivatives. It includes the history of Traditional Candles, Heikin-Ashi, Renko, Anchored VWAP, and Realized Price. It can be translated into Spanish right there.
https://cryptoquant.com/community/dashboard/69706233a662164c84864d2c
• In another order, I emphasize that each reader must decide whether or not it is worth investing in Bitcoin or another asset in the short, medium, or long term, in case they consider them undervalued. What is presented here is not an investment recommendation; each person must conduct their own research and arrive at their own conclusions. One must always invest prudently.
Entity, with buying and selling strategies. Investments here are very volatile and high risk.
The worst mistake that can be made in this market is to be impatient and let oneself be carried away by greed or panic.

Comments