
In the same way I did with Ethereum, I will analyze the data from various indicators to structurally see what differences Bitcoin had between its all-time highs of 2021 and 2025.
First, I share the general comparative chart. Then I will explain with educational conclusions what these data represent:
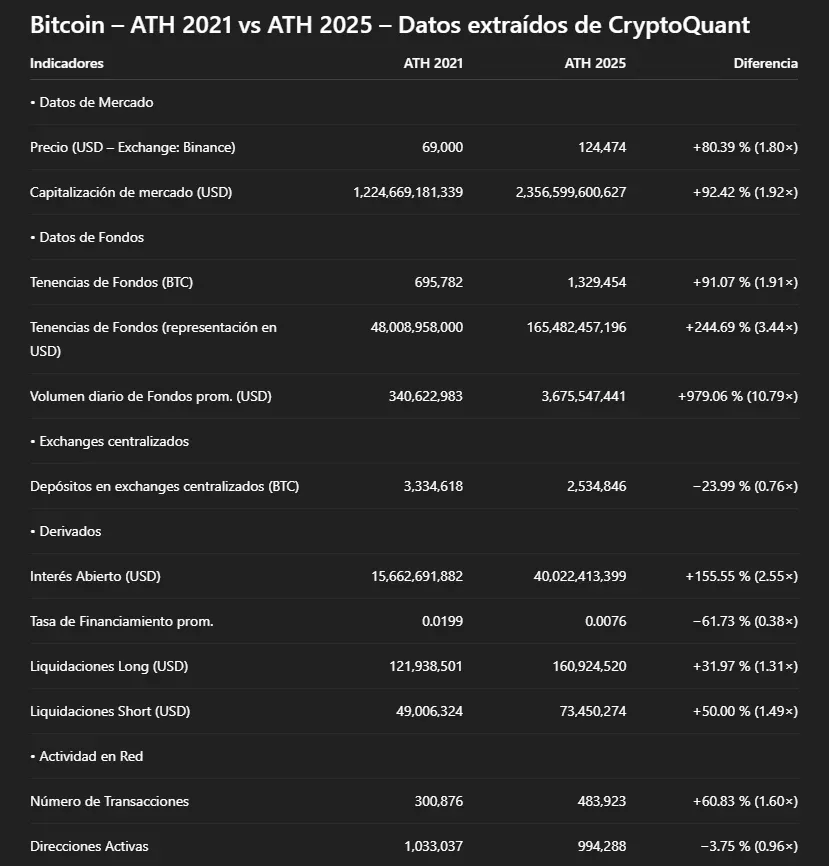
Clarification: In all the on-chain charts, the white line is the price of Bitcoin.
• Investment funds
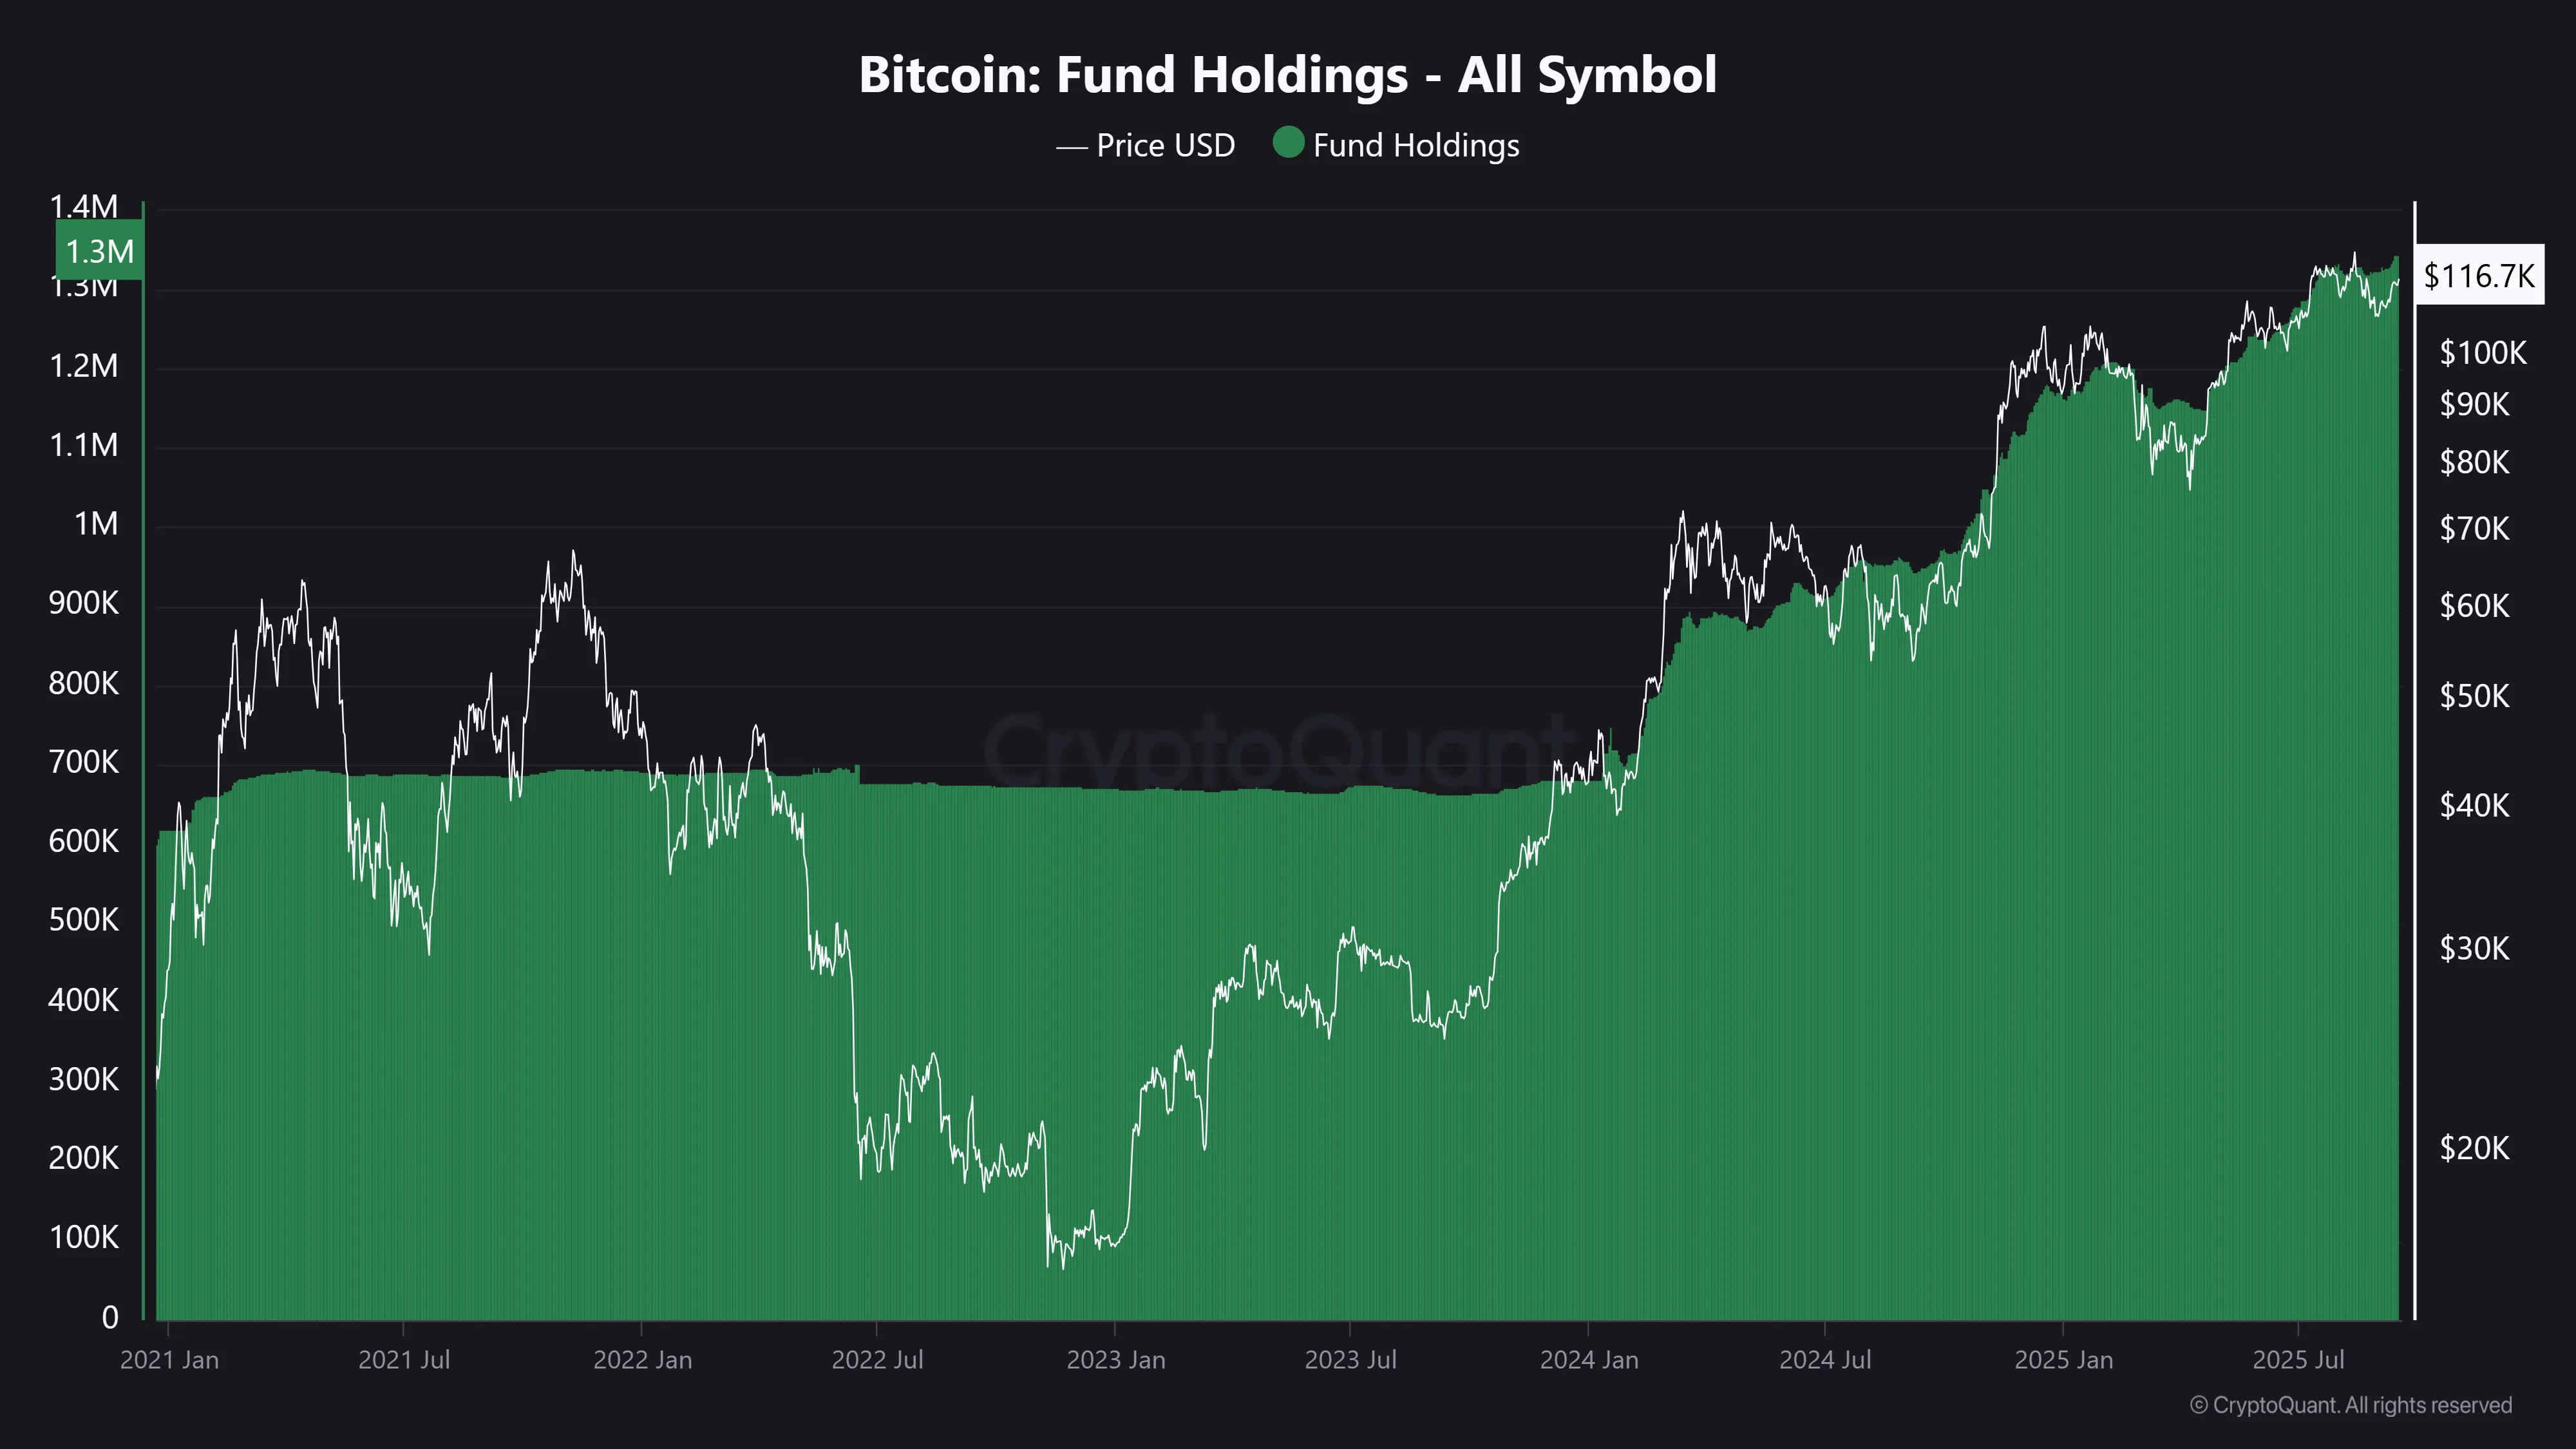
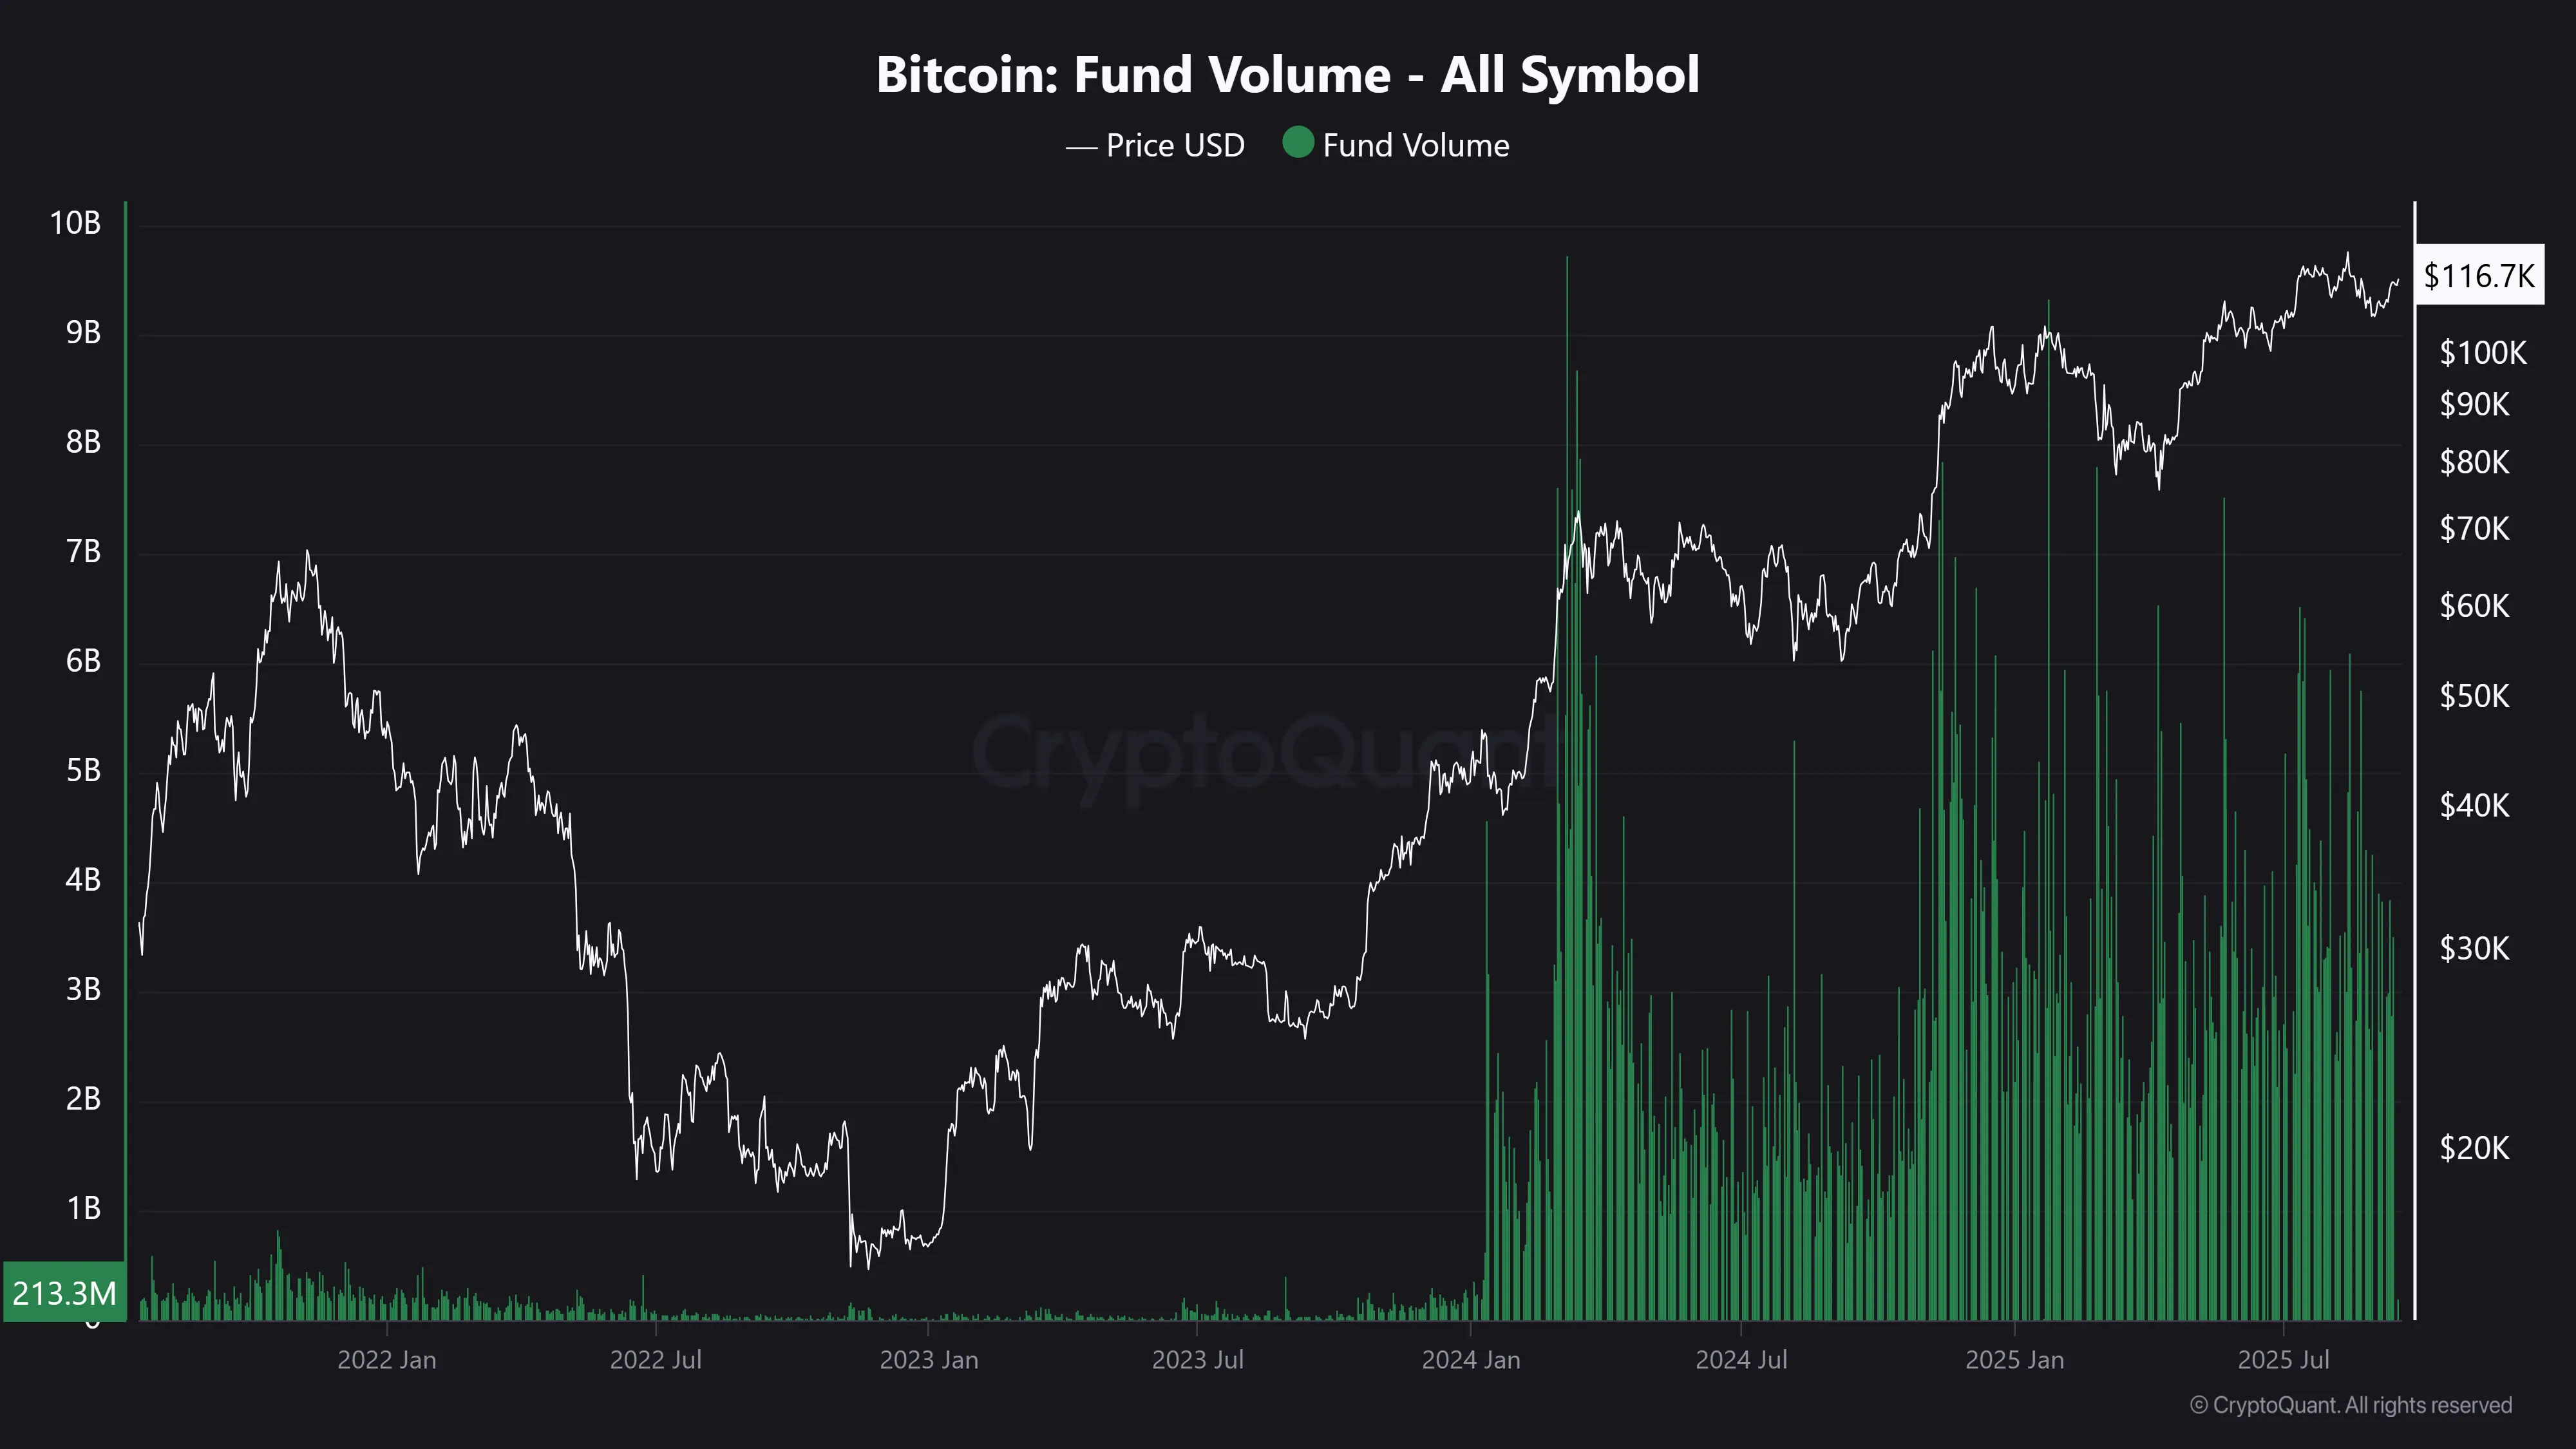
The holdings of BTC in the hands of funds nearly doubled (+91%), rising from 695,000 to 1,300,000. In terms of their representation in USD, the increase was greater (+244%), due to the rise in Bitcoin's price, going from 48 billion to 165 billion USD. Meanwhile, the average volume traded by these institutions grew almost tenfold (+979%), scaling from 340 to 3,600 million USD.
Conclusion: These differences, between 2021 and 2025, demonstrate how during the intervening years Bitcoin began its stage of institutional adoption driven by its arrival in Wall Street in 2024 and by the pro-crypto regulatory agenda of the United States that just started this year.
Green area = amount of BTC purchased by investment funds:
Green area = institutional trading volume (USD):
On this point, I recommend reading the last note I wrote on the subject:
- Digital Commodities: Bitcoin and Ethereum: https://fin.guru/es/tecnologia-e-innovacion/digital-commodities-bitcoin-and-ethereum-3epklrs4ao
Topics covered:
A) First pro-crypto federal laws in the U.S.
B) The institutional evolution of Bitcoin and Ethereum.
C) Ethereum and its ecosystem.
D) The Wall Street narrative.
• Deposits in CEXs
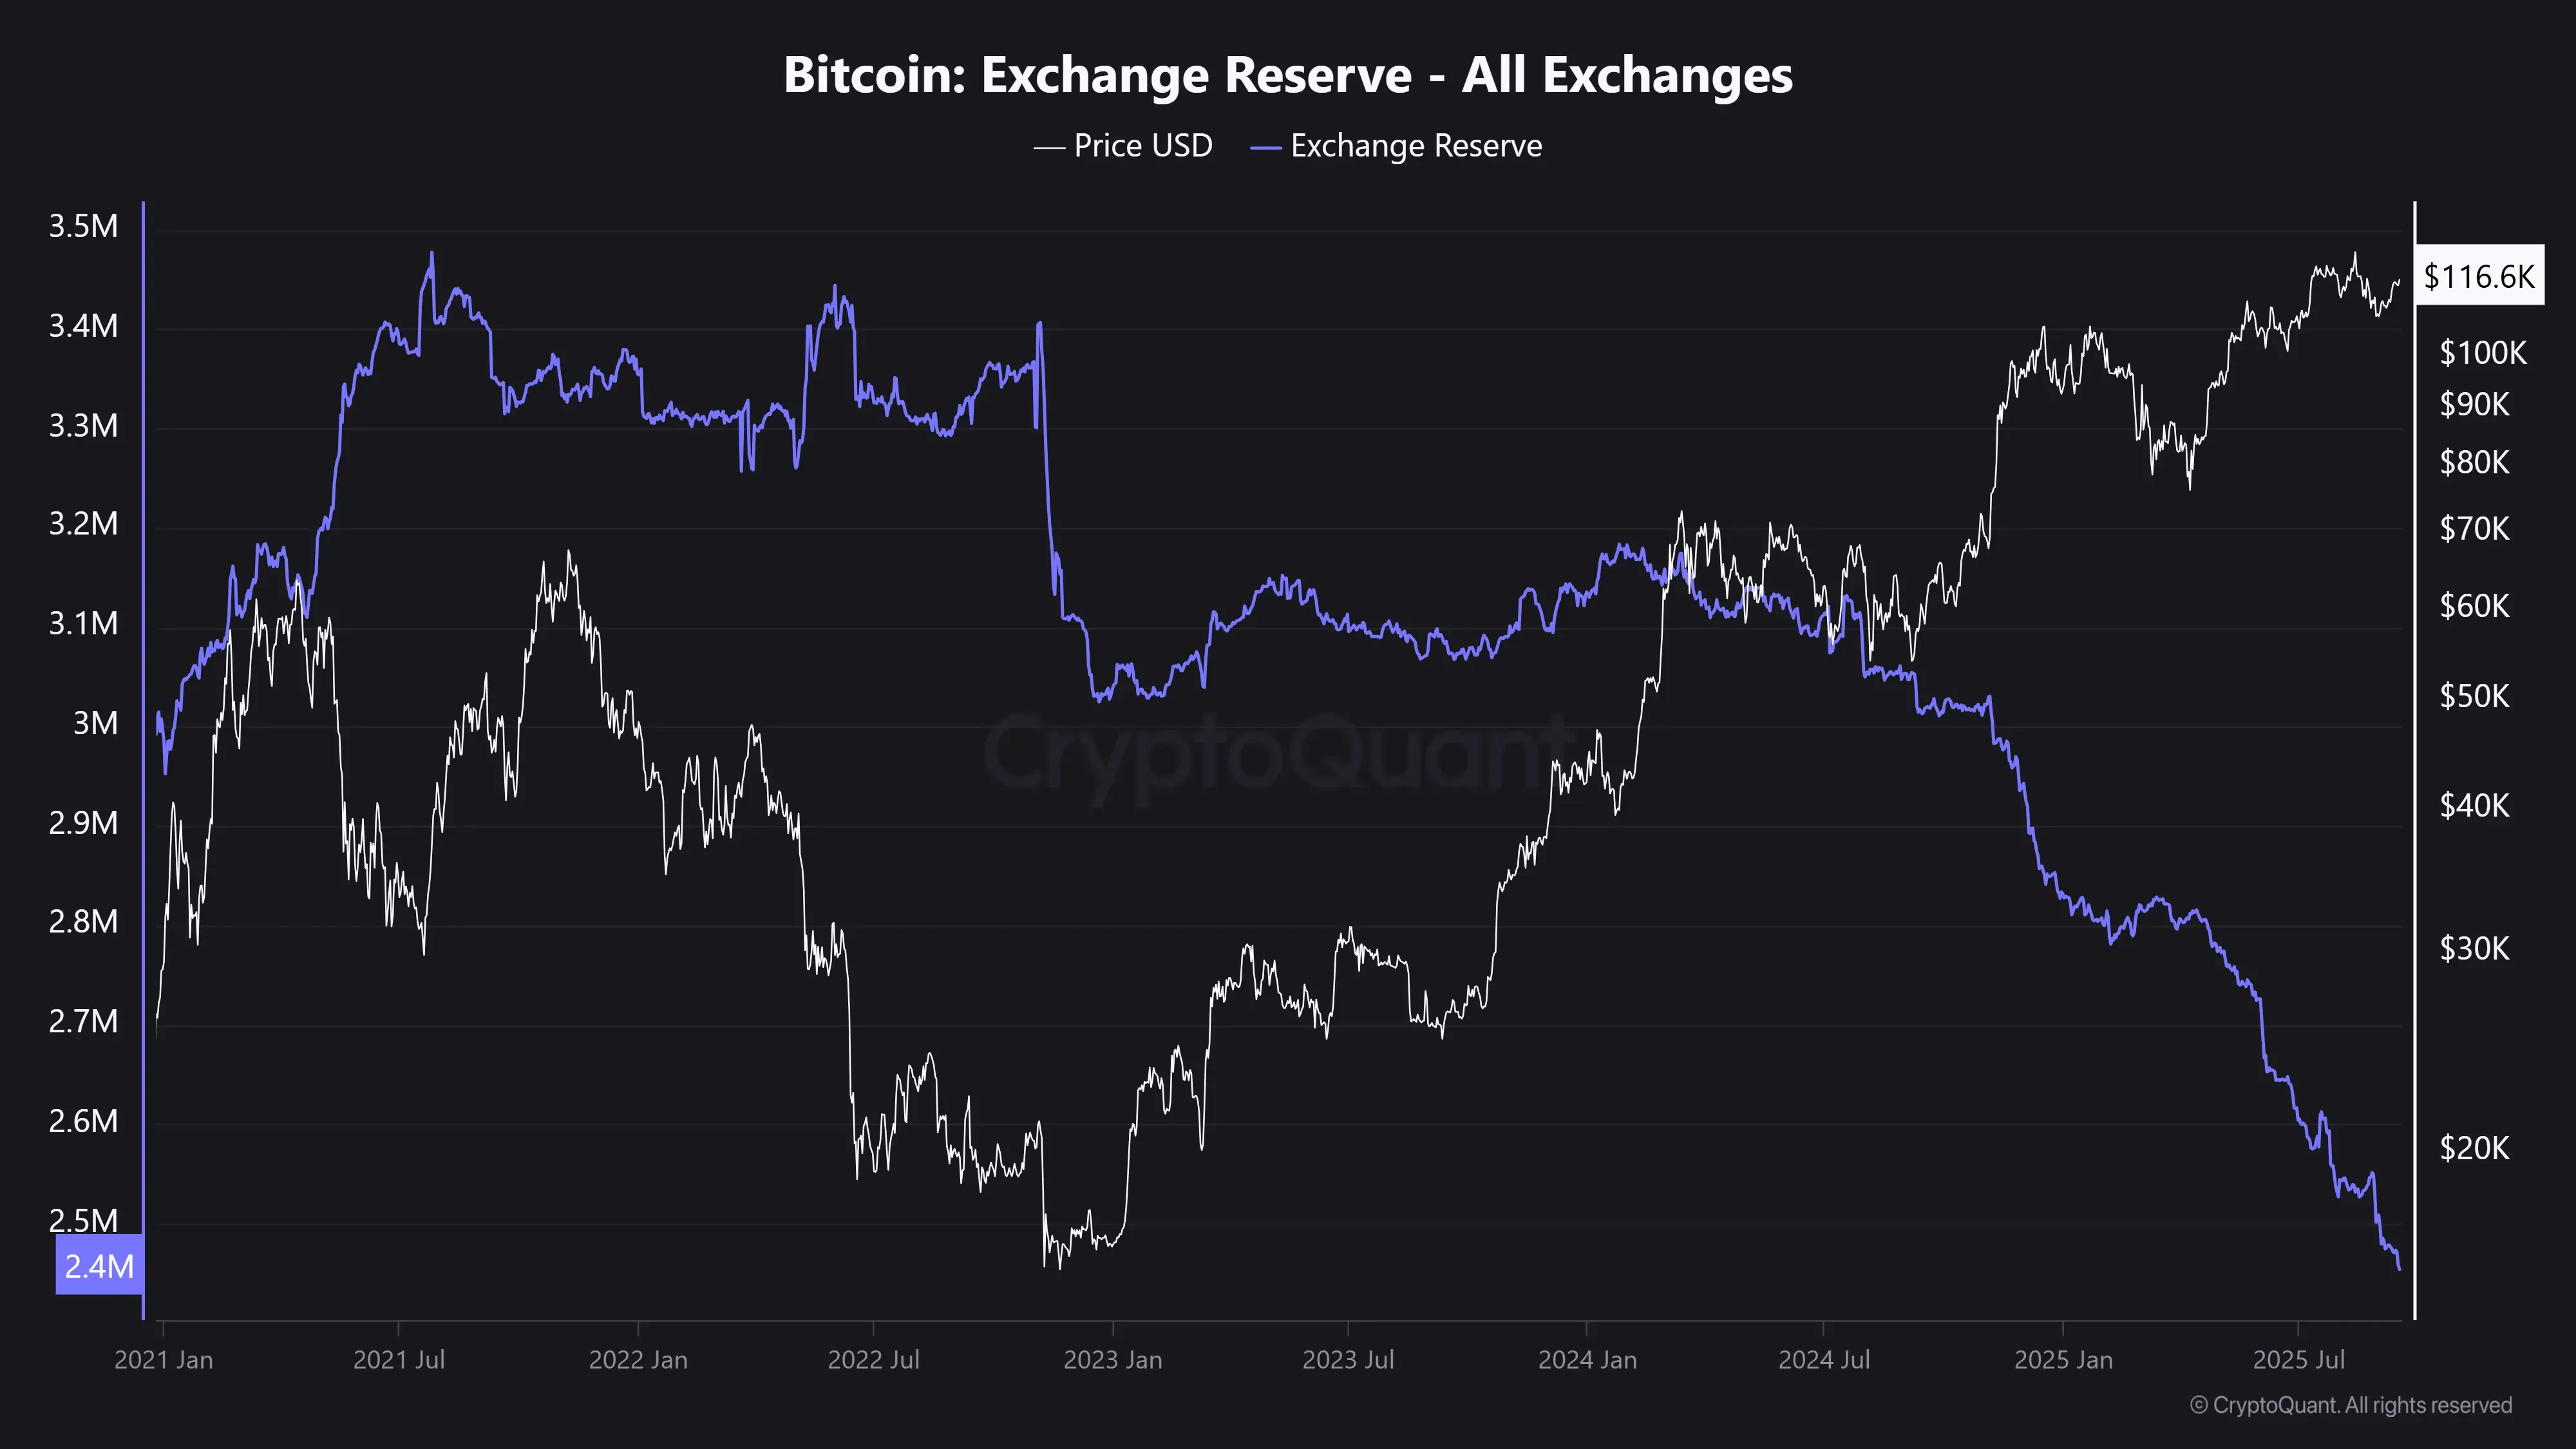
Currently, there is less supply available on centralized exchanges (cryptocurrency banks, such as Binance) than during 2021. The Bitcoin deposited there fell by 24%.
Conclusion: The low supply of BTC on CEXs creates an environment prone to fewer sales.
Purple line = amount of BTC deposited in CEXs:
• Network activity
The on-chain data shows a network with more movement in operations, although almost unchanged in the number of active addresses. The number of transactions grew from 300,000 to 483,000 (+60%), while active wallets slightly decreased by 3%.
Conclusion: The use of Bitcoin's blockchain remains solid, with a higher transaction volume despite the slight decline in the number of active addresses.
Purple line = number of transactions made on the BTC blockchain:

• Derivatives
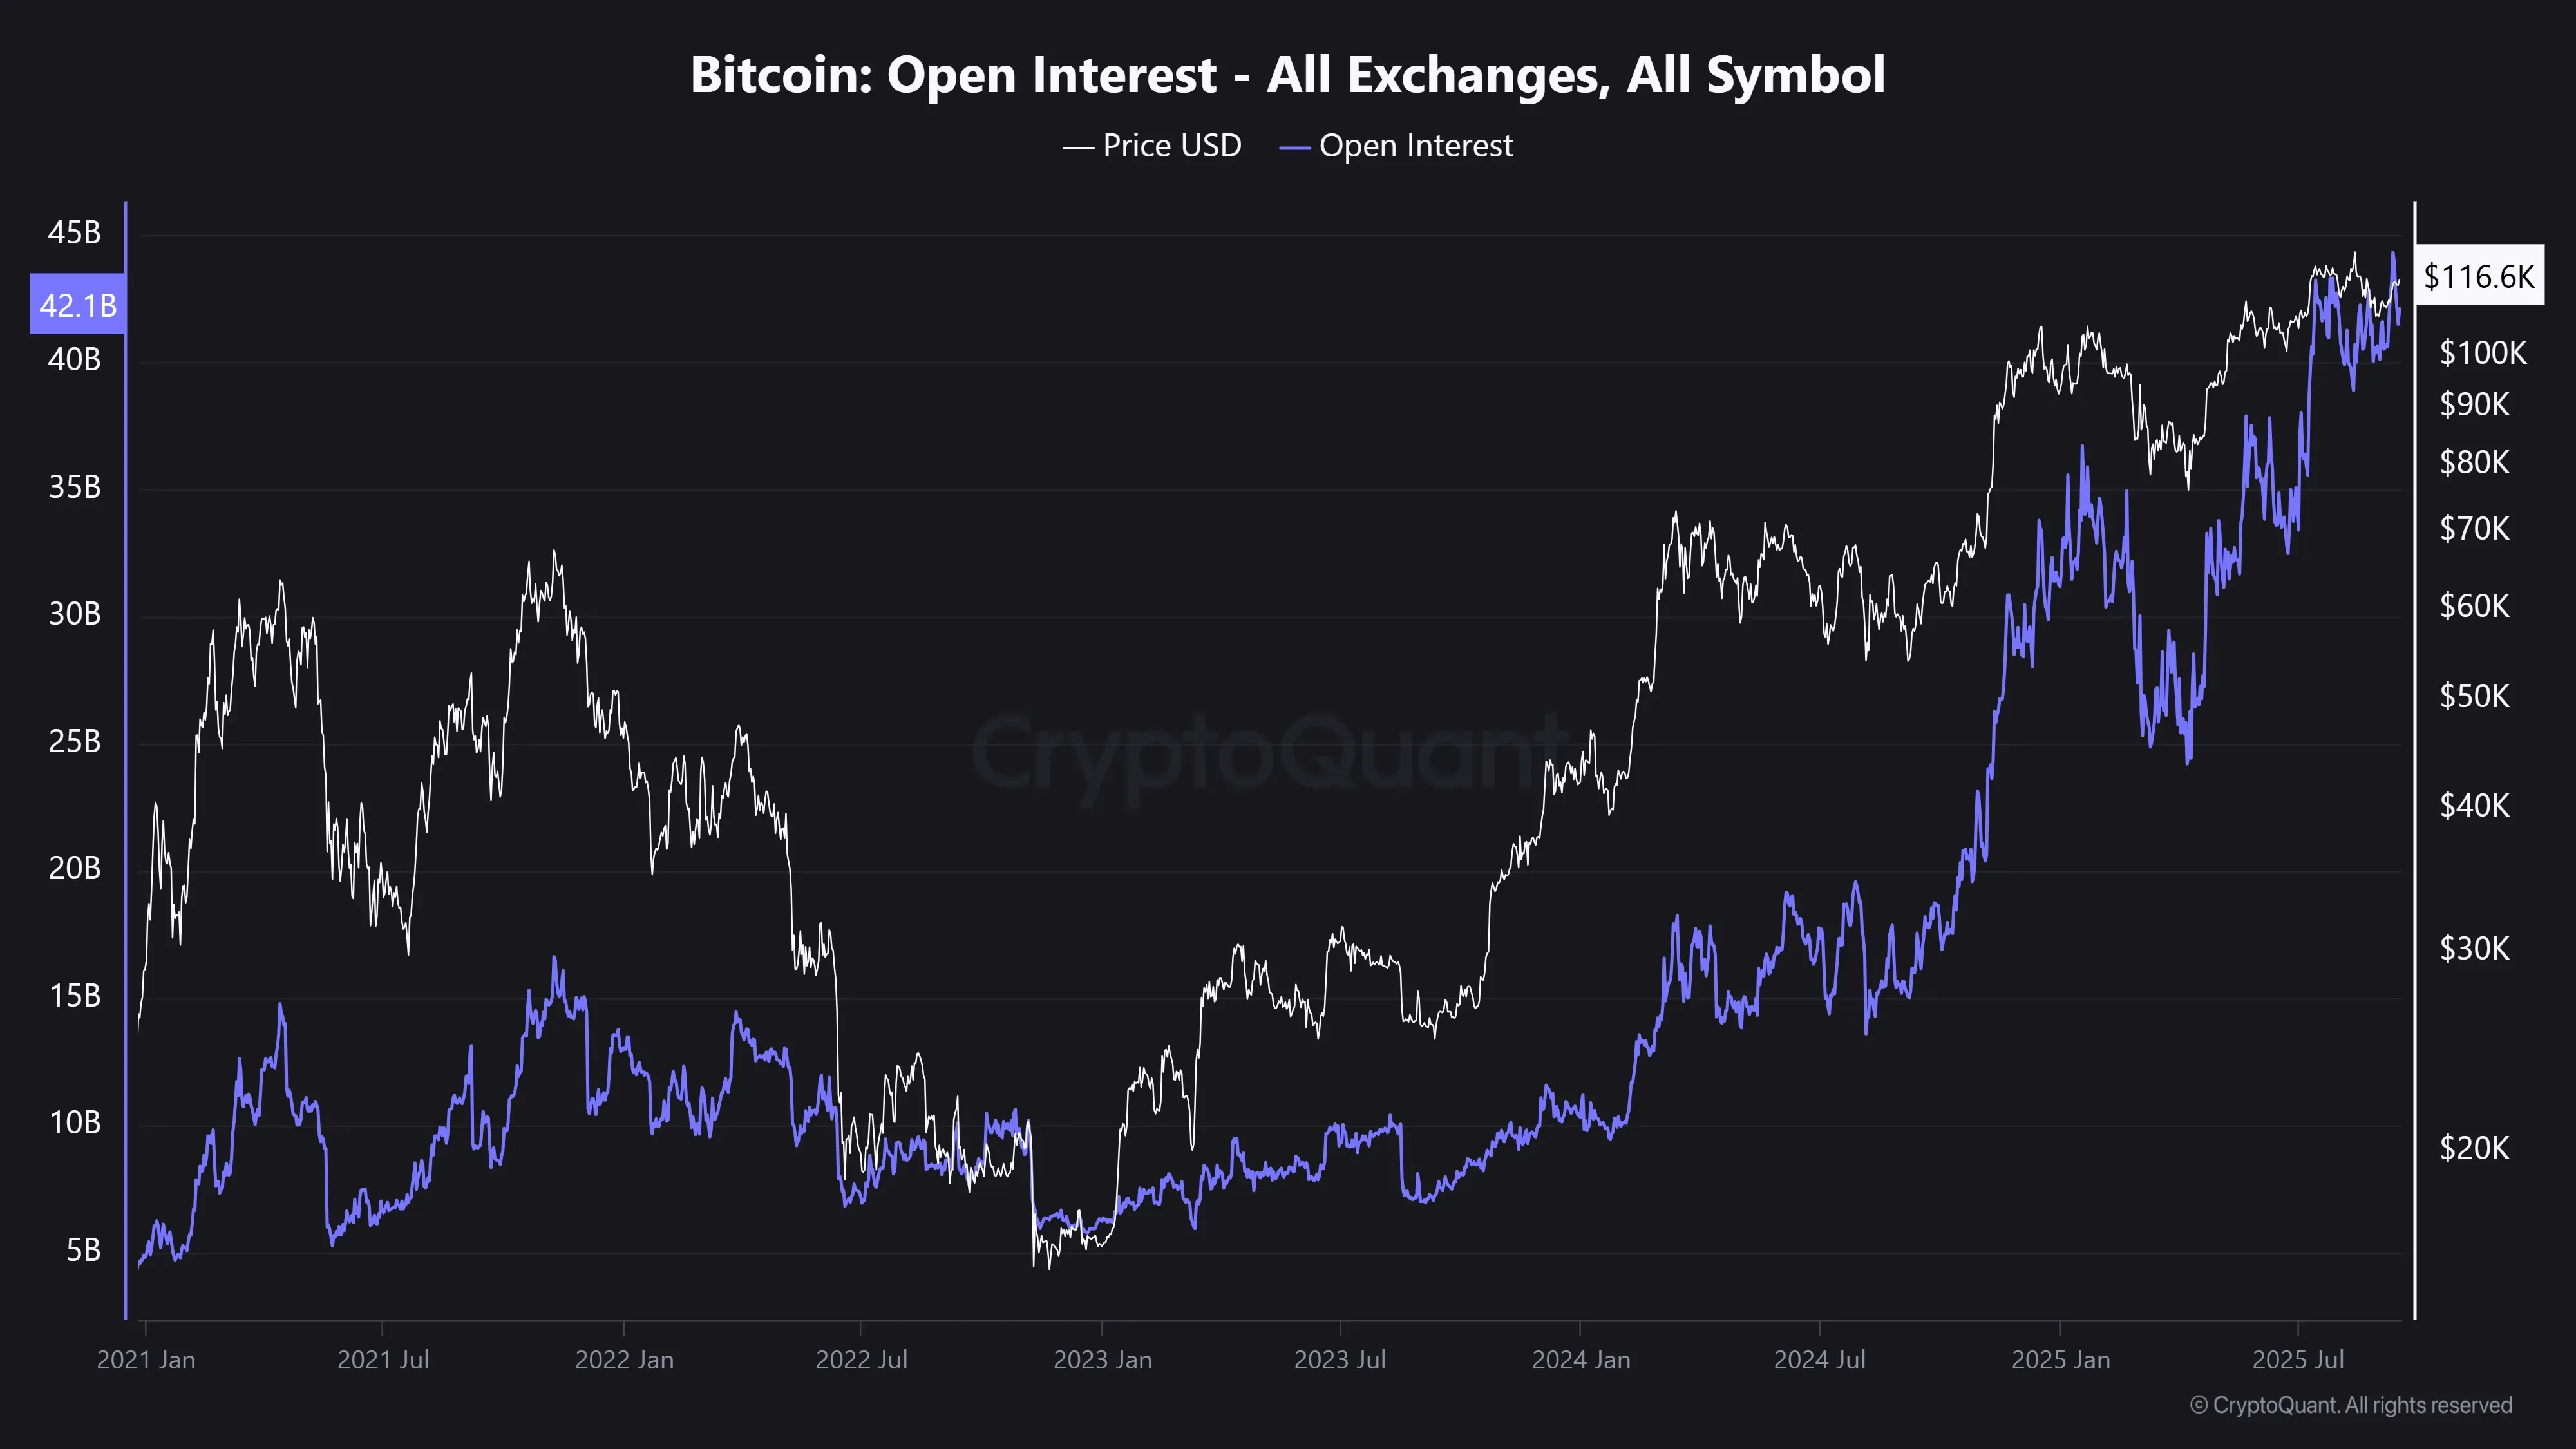
The open interest (amount of USD committed in the derivatives market) is currently 2.55 times higher than that recorded in 2021 (+155%), growing from 15.6 billion to 40 billion USD.
The financing rate decreased by -61%, indicating a market with more balanced long and short positions compared to the scenario four years ago.
In terms of liquidations, long positions increased by +31%, while short positions recorded a more pronounced jump (+50%). This indicates that squeezes occurred on both sides, with greater impact on the bearish side.
Conclusion: The growth of open interest, along with more moderate funding and an increase in liquidations, configures a larger and more dynamic derivatives market than in 2021. This combination raises the likelihood that Bitcoin will be volatile, making prudent risk management with stop loss (an order that gets executed automatically when the predefined price is reached) essential when trading.
Purple line = USD committed in the derivatives market:
• In case you want to see the same analysis but on Ethereum, I share the link:
- Ethereum: What differences do the indicators show between 2021 and 2025?:

Comments