
Technical service of data science disciplines
Before you start, let's think that it consists of data analysis and what are the important areas within a data team. There are different races, or subgroups, which are in charge of processing and extracting information, or “insights”, which create an impact in the organization they are working for. In great traits, we can think of two groups, the ones that prepare the data, and the ones that analyze them.
Data preparation
There are many careers dedicated to operating, maintaining and transferring the data, which are of pure technical character in terms of databases, but we can group them by understanding them as people in an organization dedicated to processing all operations carried out by a company, from a sale, to the conformation of a report, and keep them in a stable, orderly, accessible and secure manner.
This data must be ready to be used in daily operations (such as sales for a cash closure, or banking and commercial operations for a report and economic control, and even user information to load a virtual or physical cart to perform a sale). All of this data, once its daily use or short periods, are required with high frequency, become consolidated and stored.
Sometimes this is done in deposit databases, stable in format, and orderly, and sometimes, in several places, from paper to various database formats, in a disordered manner. Of course, the quality of the database operators, and/or the management system that the company uses, will determine the quality and simpleness with which this is done.
Data analysis
Now, here comes the role of the data professional, who is responsible for analyzing this information in order to generate an impact. One of these papers is occupied by the data analyst, the paper we're going to see a sample. This is in charge of observing all such data, sending them, changing their disposition, and understanding their relationships, in order to obtain new information, from the relation of these.
This accomplishes it with data tools, to extract, and presentation and visualization tools, such as Excel, PowerBi, Tableau, among the most highlighted. The goal of the data analyst is not to explain the transfund of your analysis, but rather that of present results that are ethically correct (from reliable and verified sources, and without bias or interest in testing something beyond what data tells us) so that the audience reading this analysis can understand these findings, and can thus make informed decisions.
The role of the data analyst thus becomes essential for any organization that wants to understand the processes of your company and the relationships that exist between the decisions made, the external factors and the investments made; with the change of parameters that can be of interest (from the acidity of a means in cellular reproduction, the type of advertising investment and the impact of this on sales, or the image of the organization).
We develop data analysis
Data analysis allows us to think in depth about the information we use in decision making. We often find that in any management process the need arises to focus on choosing priorities, or we have to make information-based decisions that can come from many sources and in many formats.
The theory of stroke
In the following analysis, we will focus on trying to provide something of light in an argument that is proven by much more quantitative analysis than mine, but not for the particular case of Argentina. The theme in question is the theory of stroke, argentinization of the theory raised by Simon Kutznets in 1955 to explain the relationship between the average yield, and the increase of the wealth of a country.
This is a theory that was widely used by governments in Argentina to direct the economy, prioritizing gross growth, control in the distribution of wealth, claiming that this was a by-product, of direct relationship, with the growth of the economy in general. If the productive sectors, in particular the holders of the productive capital, increase their earnings and capacity, then this will have a direct positive impact on the population.
This theory, which continues to be taught in very important universities, from some developed countries, is a theory that has enjoyed a lot of cabildeo, which made even the Kutznets, who found their original plan as a fall of real context, or better said complete, would refute this precaution about their veracity, after a few years of good treatment by sectors of economic power, and present their founding foundations.
We will also see how this, with a superficial analysis, can be easily acceptable, but that, deeply analyzing the theme, there is no strong correlation between enrichment of some, and the benefit of many.
Data
The data I used comes from sources that are probable, and explicit to be able to search and test by hand. But they were treated by me to be clearly understandable, and to homolog them in a currency, so that you can only have an understandable unit of value between all parameters.
The charts are determined in years, and on a total average, or in 1992 US dollars adjusted to inflation in that country intermonthly. It is worth noting that many data were originally in weights, and that it also converted dollars with interpersonal relationships, to then be adapted to the 1992 dollar. In this way, we emulate a fixed relationship with the dollar, and an inflation 0, where we will see natural fluctuations in the economy and wage.
Finally, it should be noted that there are many other data that are extremely relevant in terms of distribution of wealth, such as accumulation and distribution of capital and private property, as well as factors such as access to education, and other essential services. But in this case, I pray to focus on the average pocket power of the Argentinean, in a way of refuting the original theory. I invite them to read “The Capital in the 21st century” by Thomas Piketty, where this refutation is performed more methodologically, and with a much wider temporal and demographic space.

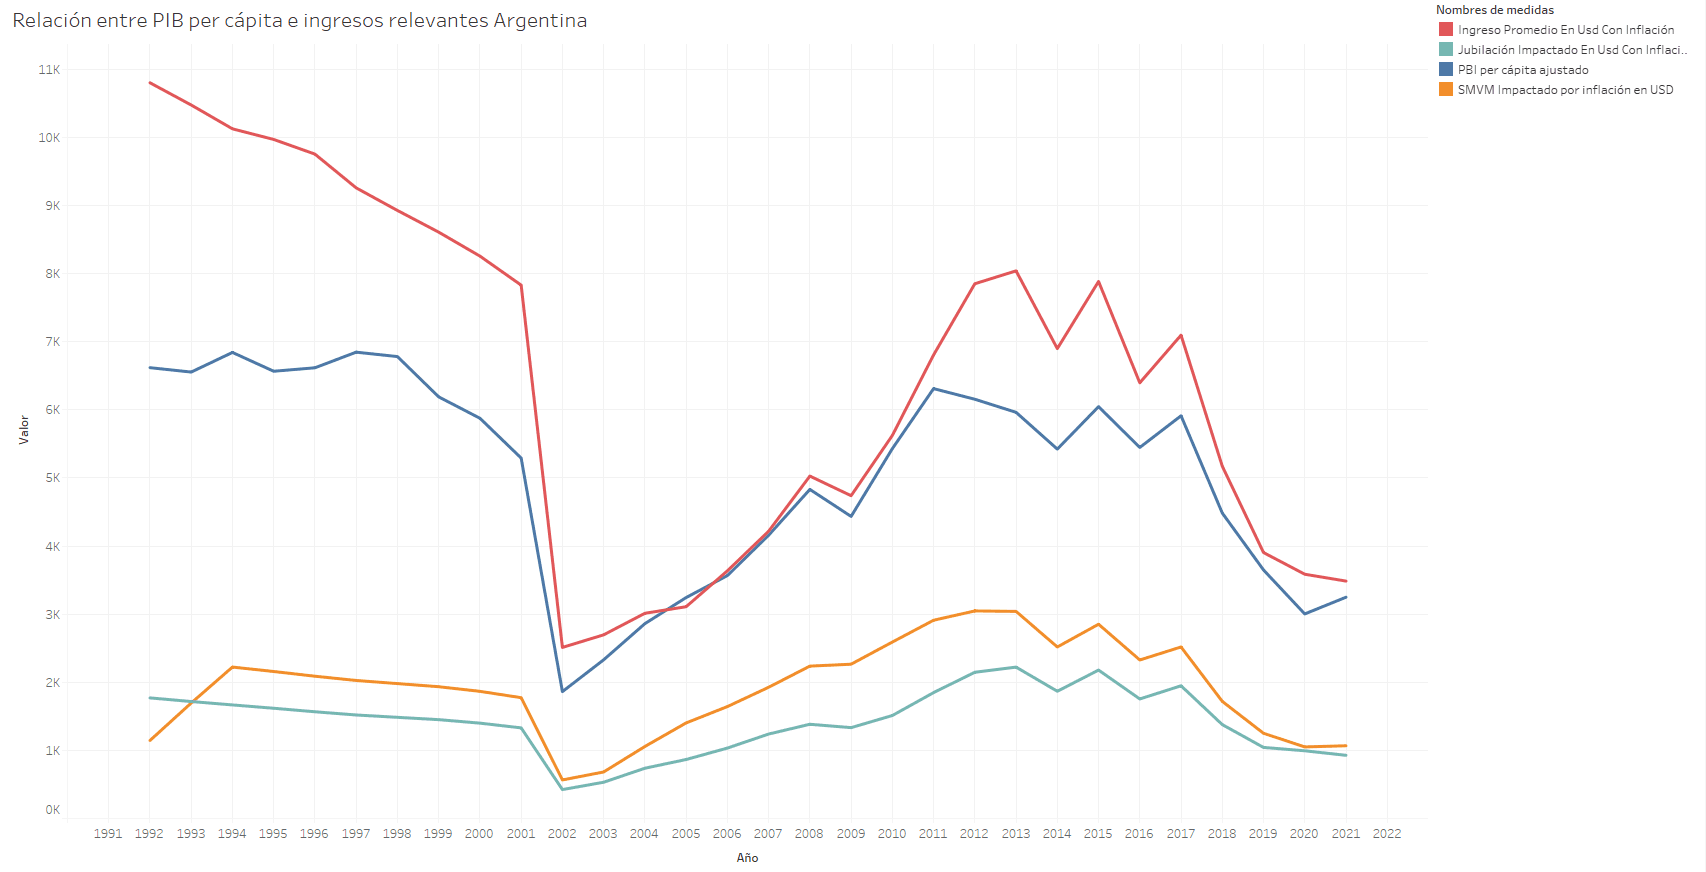
In this chart we can understand that so easy is to accept or support the theory of stroke. We can see, in simple terms, a relationship that seems direct, between the GDP per person, and the average income, the SMVM (Minimum Vital and Mobile Room) and the minimum retirement. We can also note the economic trends of each government, with successes, failures and crises.
That's why it's important to pay attention to what, perhaps, an analyst might look, or rather, used to looking. In a more acute inspection of the graph, we can observe a variation between the distances of the different lines in relation to the vertical axis. We can note that, at times, positive and negative gaps increase and decrease, showing the difference in relationships being given.

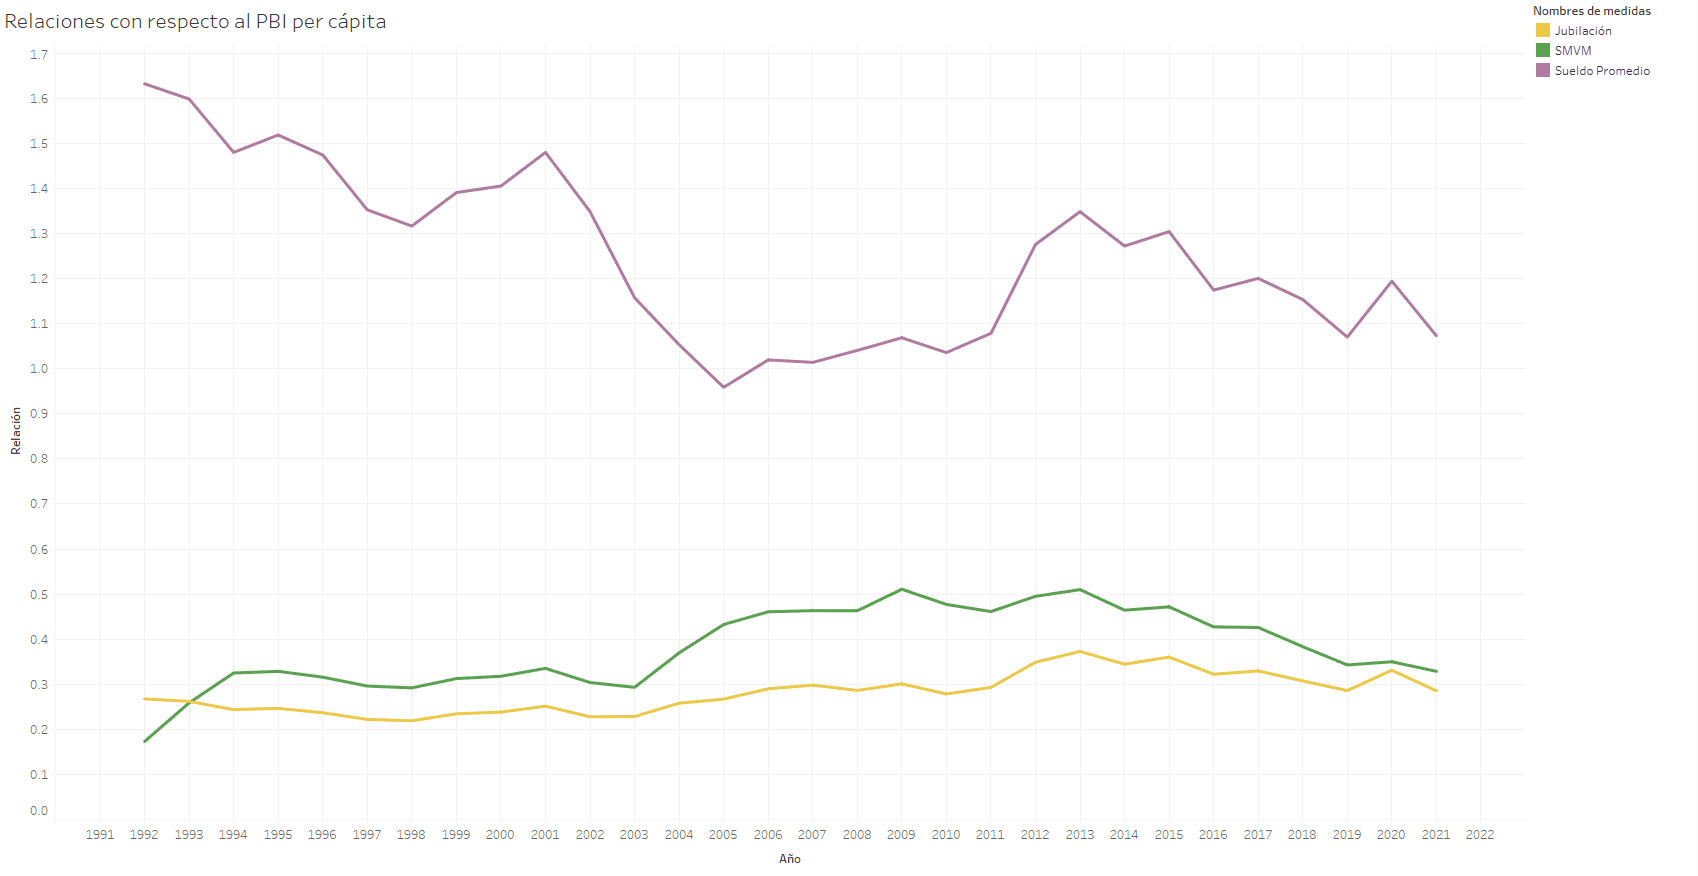
In the second graph, we can see in a clearer way how there is a great variation in the relation, or participation of income, in relation to GDP per capita, which is independent of the value of the latter.
Conclusions
We can determine that a country can experience economic growth, without having participation in wealth, and that the opposite can happen. Clearly, we have lost much ground in terms of economic equality over previous years. It is also important to see that, although a larger impositive charge, and containment plans and social benefits seem tenth the average purchasing power, it seems not to generate this effect, but to go from hand.
Data science, as a science that contains data analysis, is an important tool to obtain trustworthy information, and lead us to streamline communication, be able to express and corroborate thoughts, ideas and observations, and become useful, at the time of finding margins and paradigm changes at key moments in the development of a country, as well as a company.
Sources:
https://www.macrotrends.net/countries/USA/united-states/inflation-rate-cpi
https://www. ambito.com/contained/dolar-informal-historico.html

Comments