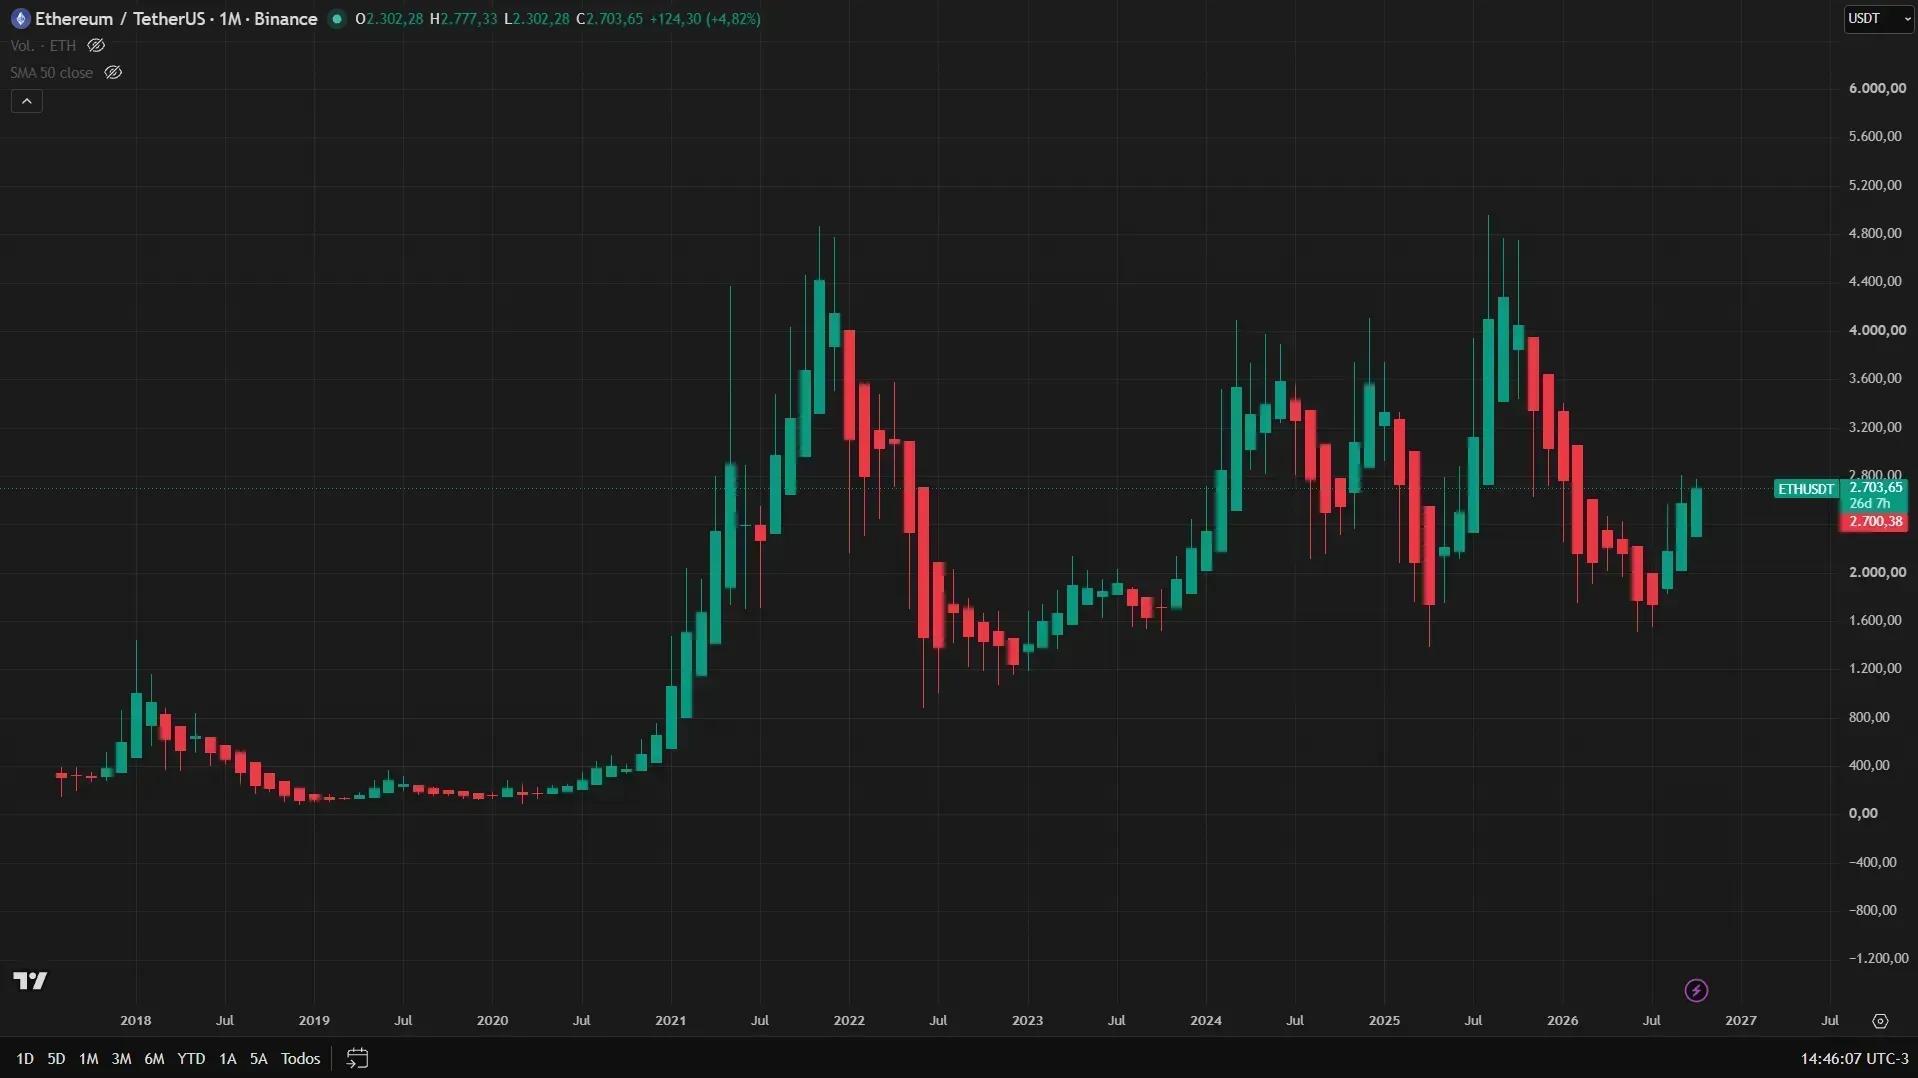
I analyze the price action of Ethereum, its on-chain and derivatives data, to determine its current state.
A) Price Action
Weekly timeframe, Anchored VWAPs, and Heikin-Ashi candlesticks.
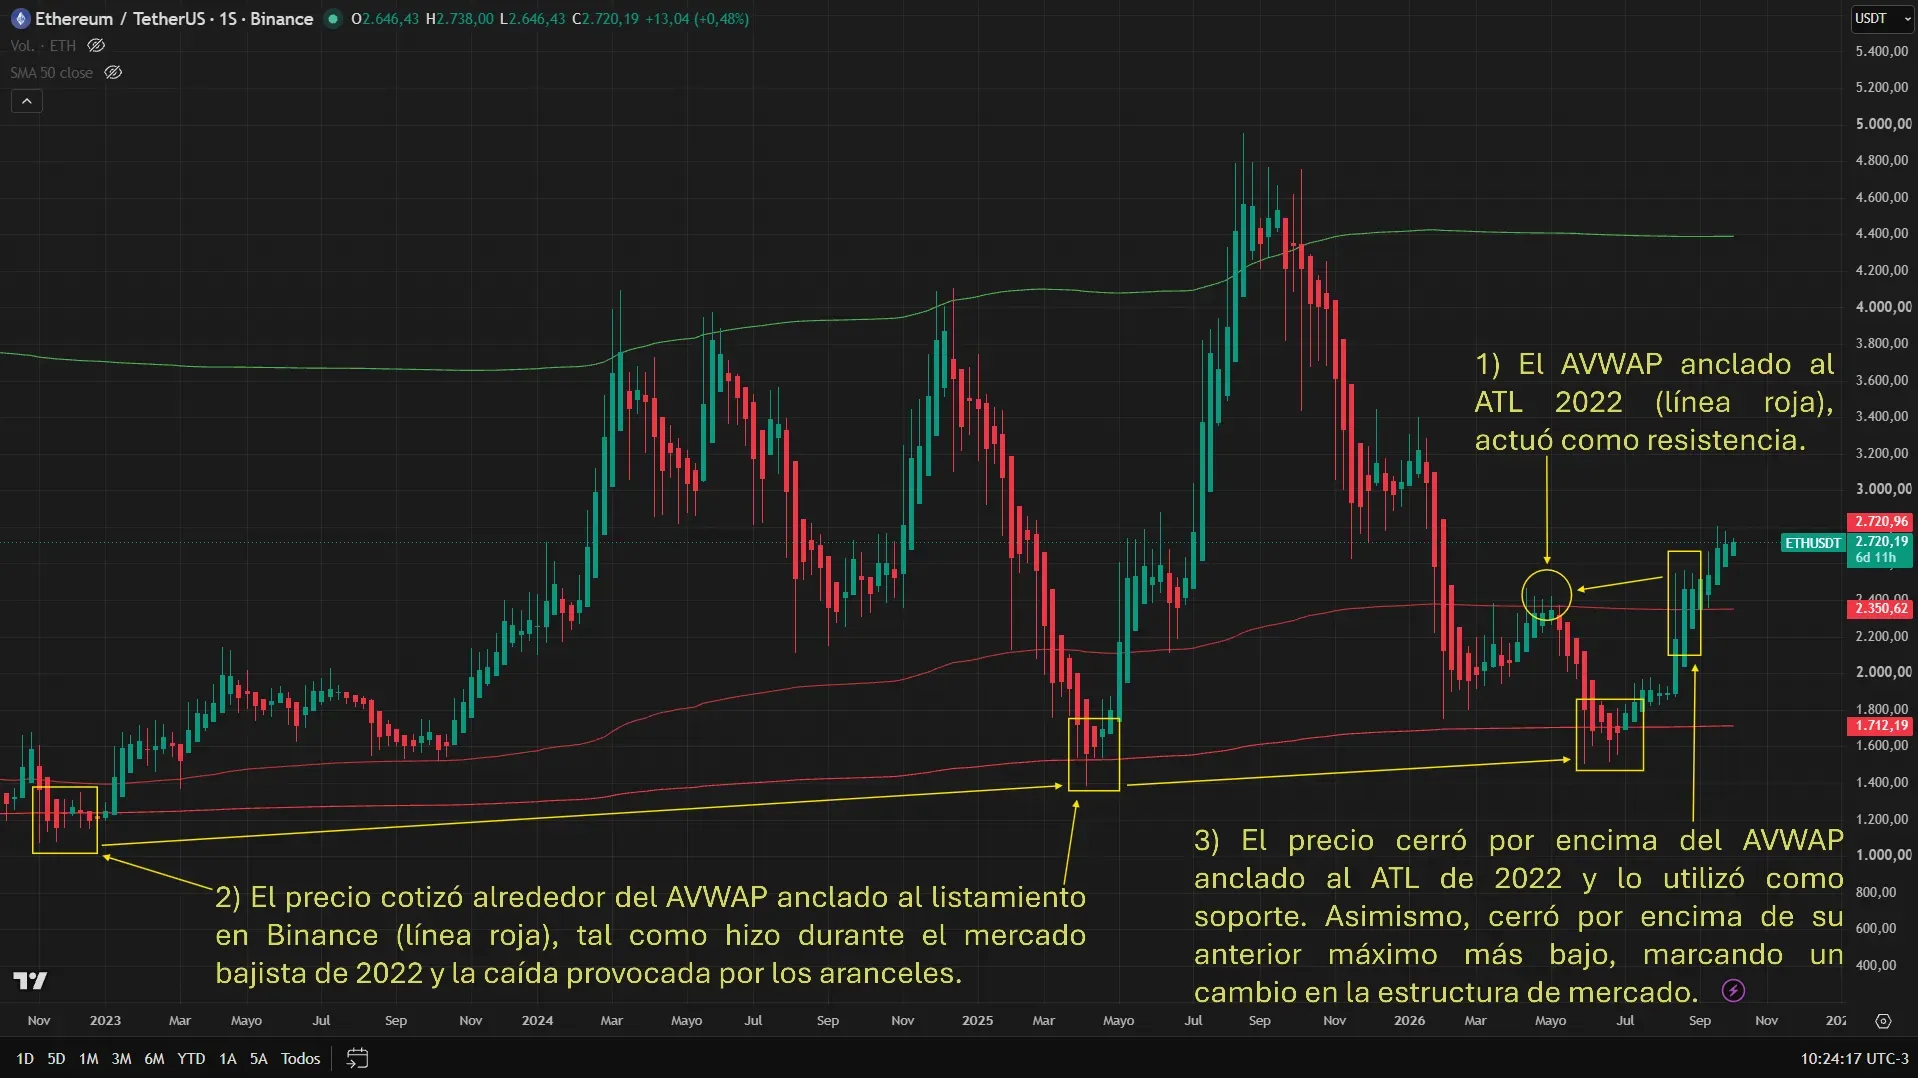
1) The AVWAP anchored to the ATL of 2022 acted as a key zone during the last bearish period. Between March and May, it served as clear resistance and a benchmark from which sellers started taking control of the market.
2) The price recovered after reaching extreme oversold levels and trading around the AVWAP anchored to Binance listing, just as it did during the bearish market of 2022 and the fall triggered by tariffs.
3) Lastly, the price closed above the AVWAP anchored to the ATL of 2022 and used it as support, reflecting that buyers regained control of the market from that point. It also closed above its previous lower high, marking a change in market structure.
B) Market
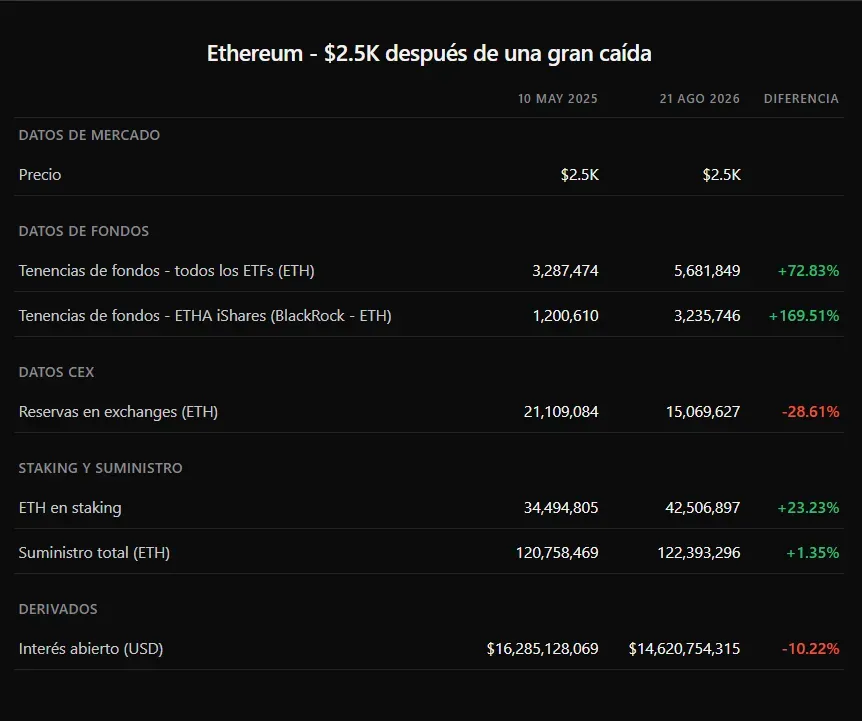
Ethereum started trading above USD 2,500, after reaching extreme oversold levels, just like it did in May 2025, but in a different market context. Reserves on exchanges are lower, staking has increased, institutional holdings are significantly higher, and open interest has decreased.
In other words, ETH is at similar values but with less supply immediately available for sale on centralized exchanges, less leverage in the derivatives market, greater institutional participation, and a larger proportion of its circulating supply committed to staking.
Data downloaded from CryptoQuant.
1) Institutional Holdings
Demand through institutional vehicles has increased significantly. The total amount of ETH held by ETFs rose by 72%, while BlackRock's ETHA holdings increased by nearly 170%.
It is important to highlight that BlackRock allocated more resources to ETH and has two ETFs: ETHA, its original spot ETF, and on the other hand, iShares Staked Ethereum Trust ETF (ETHB), which offers exposure to staking, a mode that allows for additional annual returns.
2) CEX Data
In comparison, reserves on exchanges decreased by 28%. This means that there is currently considerably less ETH deposited on centralized exchanges (for example, Binance), potentially available for sale through these platforms.
3) Staking and Supply
The amount of ETH in staking increased by 23%, while the total supply remained relatively stable, showing that staking grew significantly faster than the total supply of Ethereum.
Of the total ETH currently in circulation, 34% is now in staking, up from 28% in May 2025. This reflects strong participation in its ecosystem, despite price volatility.
4) Derivatives
Open interest is 10% lower than in May 2025, but this drop can be interpreted positively. In a context of lower reserves in CEX, greater participation in staking, and significantly higher institutional holdings, this decline suggests a healthy deleveraging rather than a loss of interest in the market, reducing the risk of liquidations.
C) Conclusion
From the price, it can be concluded that buyers regained control of Ethereum after reaching extreme oversold levels. Moreover, what emerges from the rest of the analysis indicates that this recovery occurs in a more solid context than observed in May 2025. Specifically, the outlook for ETH in the medium and long term is potentially bullish.
Finally, I emphasize that each reader must decide whether it is worth investing in any asset in the short, medium, or long term, should they consider them undervalued. What is presented here is not an investment recommendation; everyone must conduct their own research. Always invest prudently, with buying and selling strategies. Investments can be volatile and high risk.

Comments