For a long time, I heard the phrase: “saving isn't enough”.
And it's true.
Compound interest is one of the most powerful forces in the financial world, but it has an important issue: it's very hard to measure without good visualization.
The financial calculators available online work for the basics, but they fall short when someone wants to plan for real life milestones: buying a house, reaching a certain capital, or understanding how much monthly effort a specific goal requires.
That’s when I decided to tackle the problem from a place that feels natural to me: data.
The questions I wanted to answer
I wasn't looking for abstract formulas, but clear and actionable answers to questions like:
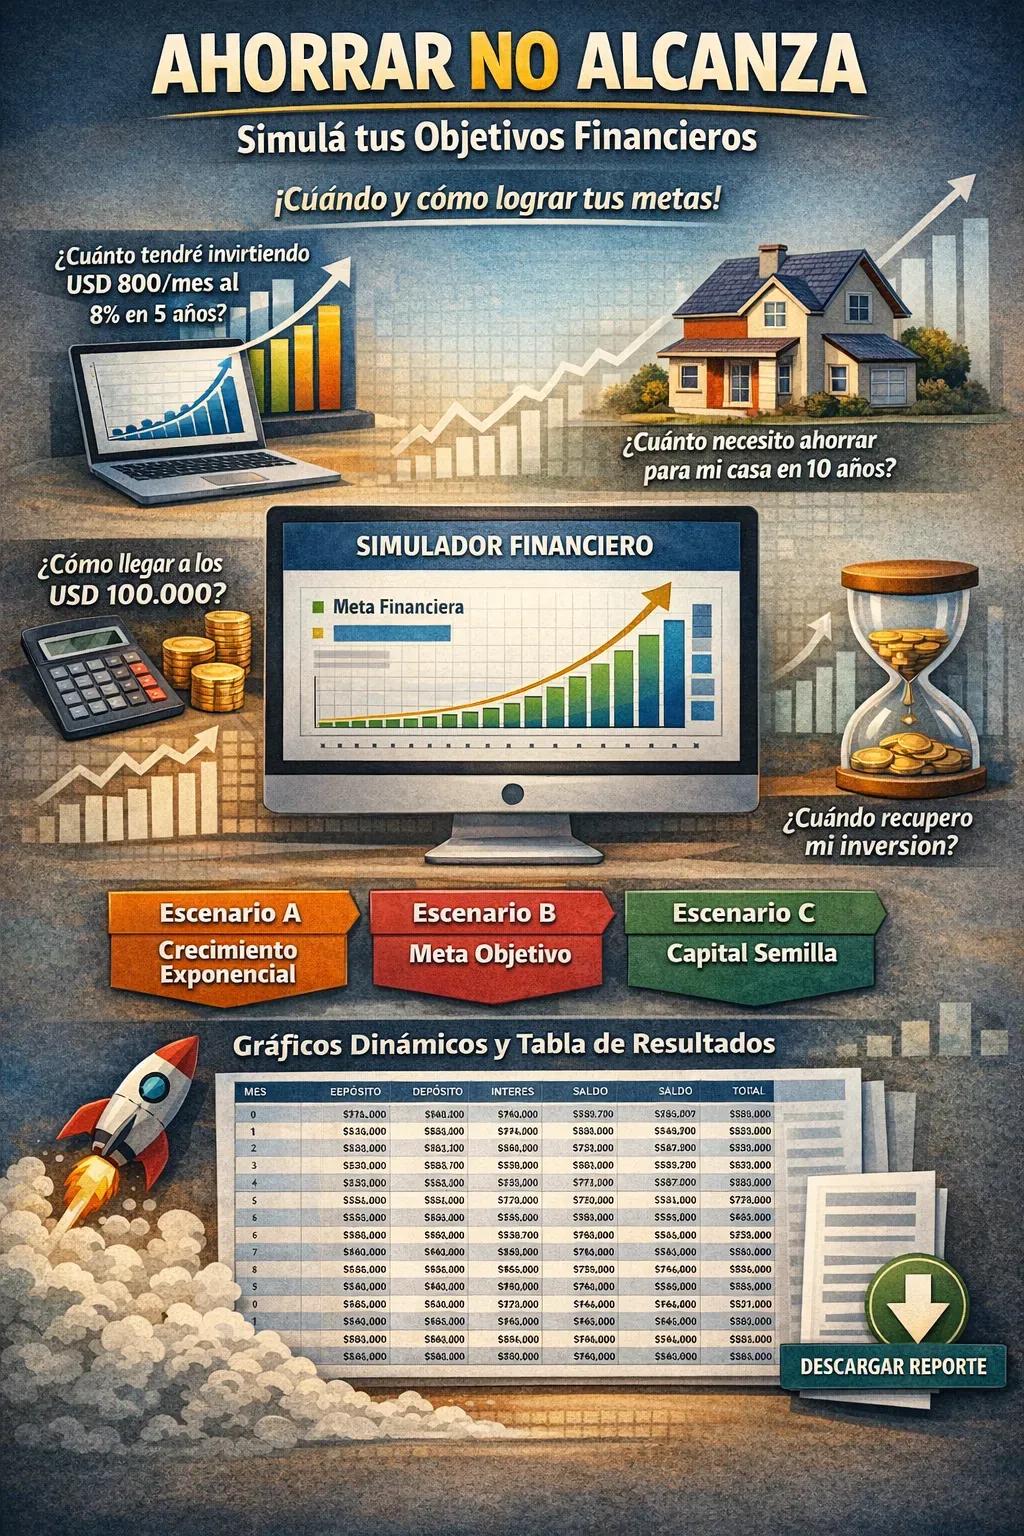
How much will I accumulate by investing USD 800 per month at an annual rate of 8% for 5 years?
If my dream house costs USD X, how much should I invest today to reach it in 10 years?
If I already have USD 10,000 invested, what is the additional monthly effort needed to reach USD 100,000?
How long will it actually take to recover the invested capital?
Answering all of this clearly, in one place, wasn’t as simple as it seemed.
From standalone calculators to a proprietary tool
Instead of jumping between Excel, online calculators, and mental assumptions, I decided to build an interactive tool.
The objective was very specific:
To have something that tells me the when and the how of each goal, with numbers, dates, and clear visualizations.
The tool combines:
Dynamic growth charts
A detailed monthly breakdown
Different simulation scenarios
All focused on making the impact of compound interest over time visible.
The scenarios it allows simulating
Scenario A — Fixed monthly contributions
A classic model of exponential growth with constant contributions. Ideal for understanding the power of consistency.
Scenario B — Reverse engineering the goal
Starts from the goal. You define how much you want to reach, in what timeframe, and with what estimated rate, and the tool calculates how much you should invest per month.
Scenario C — Initial capital + recurring contributions
Combines seed capital with monthly contributions. This scenario answers a key question:
how much does starting earlier or with something already invested change the result.
From abstract concept to concrete planning
When executing any scenario, the tool:
Shows the growth curve over time
Indicates when milestones are reached
Generates a downloadable monthly table with complete details
Compound interest stops being a theoretical idea and becomes a planning tool.
Open source: sharing to build better
I developed all of this as a personal project, but I decided to share the code openly.
The repository includes:
The notebook with the complete logic
The calculations step by step
The visualizations used
👉 Code available on GitHub:
https://github.com/FacundoG97/financial-goal-simulator
The idea is not to give financial recommendations, but to show how data can help us make better long-term decisions.
Conclusion
Saving, by itself, rarely suffices.
But investing without understanding times, effort, and scenarios is also a form of guessing.
Data does not predict the future, but organizes decisions.
I created this tool to plan my goals for 2026.
If it helps someone else visualize theirs better, then the objective has been achieved.

Comments