
There is a phrase that has accompanied me for years in this profession: "Trust takes a lot of effort to build and very little to lose." Diego Akris, who was my Data Lead at Unilever, said it to me, and since then I have verified it in every data project I participated in.
Working with data has a peculiarity that is often underestimated: what we deliver is not evaluated by the process, but by the result. No one sees the transformations, the cross-validations, the hours of data cleaning, or the complexity of the model behind it. What they see is a number in a presentation, a metric in a dashboard, a conclusion in a report.
And they take it as truth.
This puts us in a delicate position. Because when that number is correct, we generate trust without anyone noticing. But when it fails, even if just once, everything we did before is called into question.
The technical error that isn't just technical
Let's suppose an analyst presents a monthly report with a sales metric that doesn’t add up. It could be a filter error, a poorly executed join, or a misconfigured time dimension. Technically, it's a minor problem. But for the person receiving that data and making decisions based on it, it is not a "filter error". It is incorrect data. And if they've already made a decision based on it, the problem escalates quickly.
What the business perceives is not "there was an error in the ETL". What they perceive is: "the data is unreliable."
And once that perception sets in, it is very difficult to reverse.
The hanging bridge analogy
I like to think of trust with data as a hanging bridge. Every well-executed analysis, every validated number, every consistent report is another rope that supports the structure. Over time, the bridge becomes solid, and people cross it without thinking.
But if a single rope fails — one incorrect number, one inconsistent metric — no one wants to cross. It doesn't matter that the other ninety-nine are perfect. The perception of risk sets in and stays.
In data, rebuilding that trust after a visible error can take months of impeccable work. Losing it, on the other hand, takes a single slide with a misplaced number.
What we can do: a practical validation framework
After several own and others' missteps, I put together a mental checklist that I apply before presenting any analysis:
1. Cross-validation of sources. Never trust a single data source. If the sales number comes from one system, contrast it with another. If there is no second source, at least validate against previous periods. Does the number make sense compared to last month? Compared to the same month last year?
2. Review assumptions. Every analysis has implicit assumptions: time periods, filters, segmentations, definitions of metrics. Before presenting, ask yourself: does the receiver understand these assumptions? Are we measuring what they expect to see?
3. The "common sense" test. Before delivering a number, ask the simplest question: does this make sense? If sales grew 300% from one month to the next without any special campaign, there is probably an error. Business intuition is an underestimated validation tool.
4. Document definitions. Many trust errors do not come from poorly calculated data but from poorly defined metrics. What is "active user" for one team may be completely different for another. Clearly defining what is measured and how it is measured is the foundation of credibility.
5. Have the humility to stop. If something doesn’t add up, don’t present it. This seems obvious, but the pressure of deadlines often pushes towards delivering something "more or less well" instead of waiting and correcting. The reality is that waiting a day and delivering something solid generates more trust than delivering quickly and having to retract later.
Validation is not a formality
In many data teams, validation is treated as a bureaucratic step. Something that "needs to be done" before delivery. But validation is not just filling out a checklist to meet requirements. It’s the act of putting oneself in the shoes of the person receiving that data and asking: what decision are they going to make with this? What happens if this number is wrong?
When we think of it this way, validation stops being tedious and becomes strategic. Because we are not validating data. We are protecting the trust that we worked hard to build.
Viral errors
To measure the real impact of an error in data visualization, it is enough to browse sites like viz.wtf, which collects examples of poorly designed graphs that ended up becoming objects of ridicule on social media.
Some cases that illustrate the problem well:
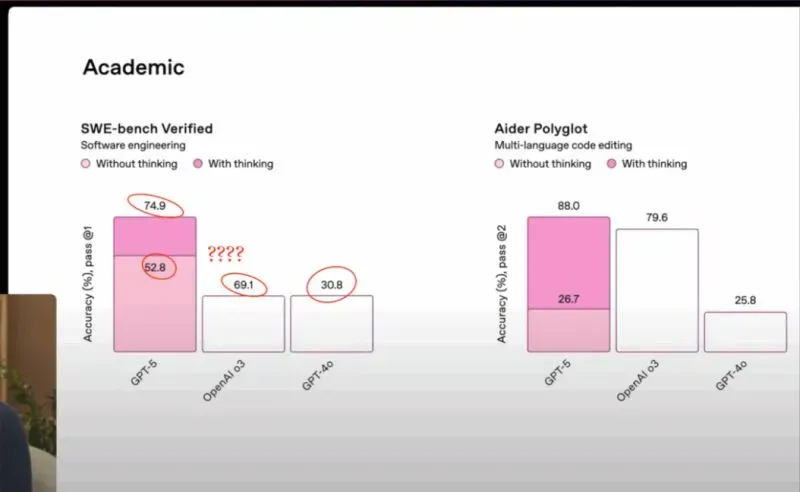
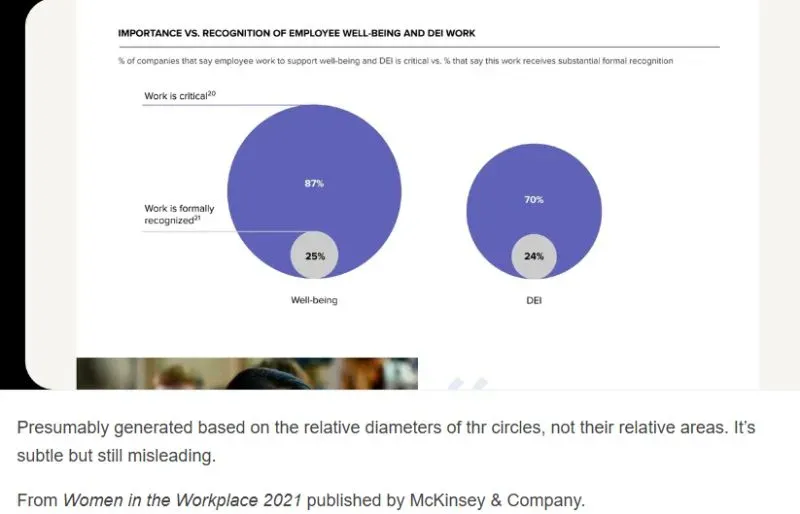
The error does not need to be catastrophic. Sometimes a poorly scaled axis or a percentage that does not add up to 100% is enough for the message to be lost and trust to break. For more examples, I recommend browsing viz.wtf — it’s a constant reminder of why visual validation is as important as technical validation.
Final reflection
In the world of BI and Analytics, our most valuable asset is not the tool we use or the model we build. It is the trust of those who make decisions based on what we deliver.
Every number we present is an implicit promise that we did our job well. Taking care of that promise, validating with rigor, and having the honesty to say "it’s not ready yet" when something doesn’t add up is what separates an analyst who informs from one who influences.
Trust is earned in grams and lost in kilograms. Let’s make sure to add grams every day.

Comments